CASE STUDY

Investigation Timeline

Designing a multi-lens investigation workspace that helps analysts trace contributing events, compare activity, inspect detection logic, and explore vehicle context without losing the investigation thread.

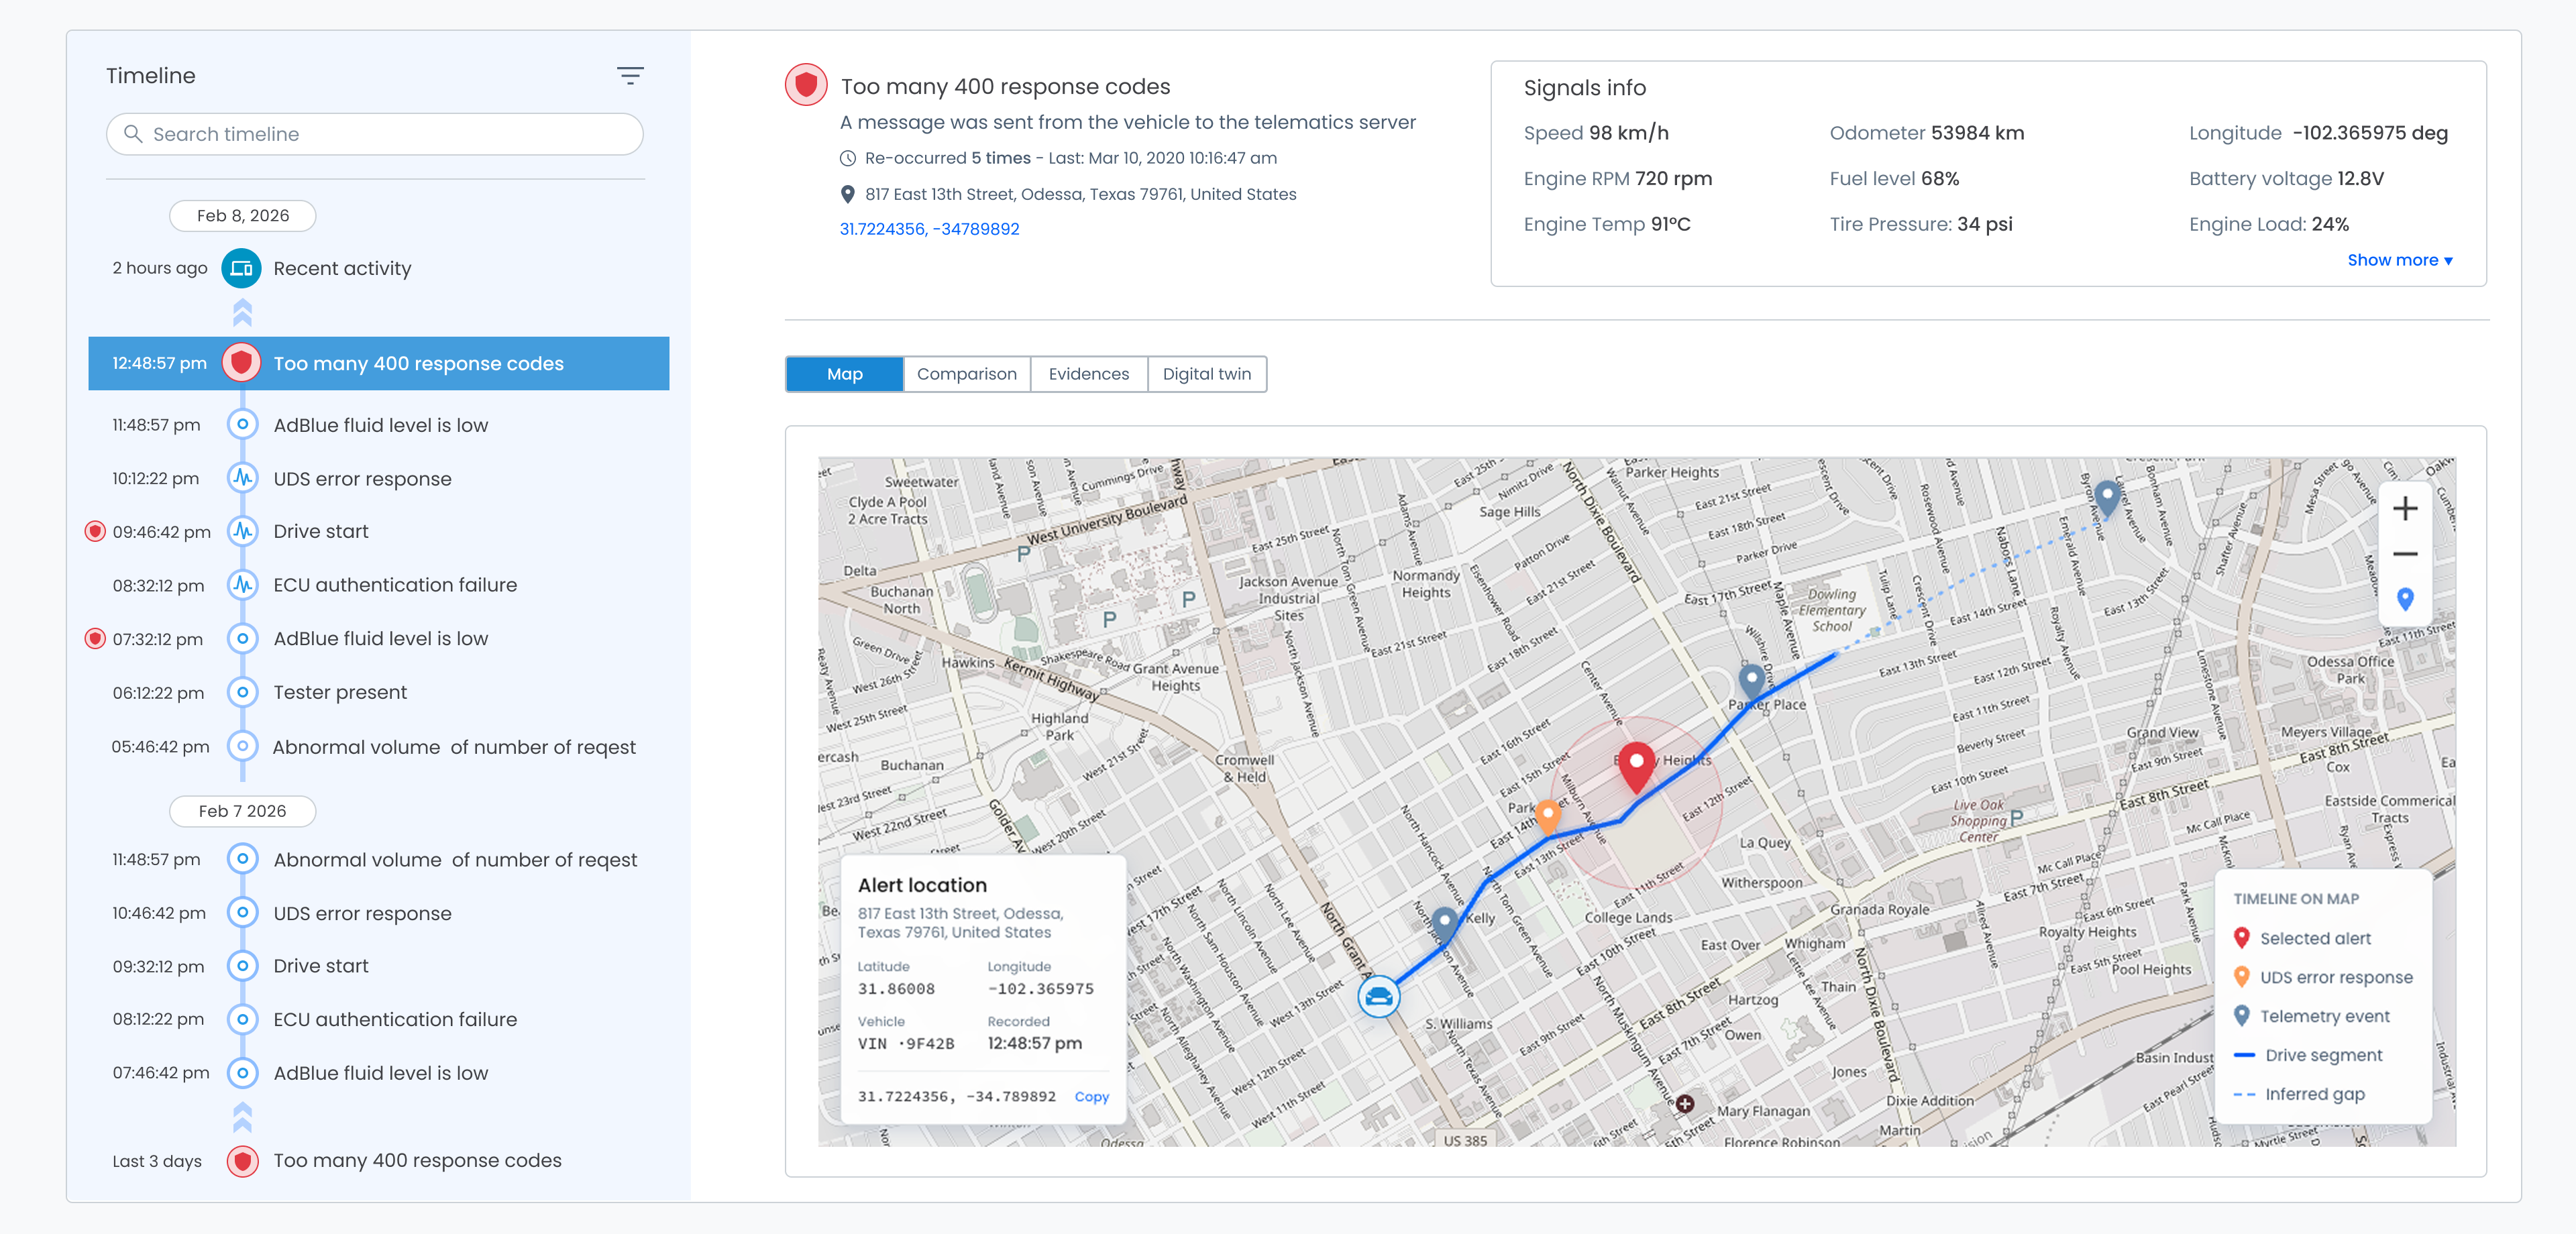
Investigation Timeline, Map view: the Timeline with the selected alert “Too many 400 response codes” at 12:48:57 pm and red contributing-event markers beside Drive start and AdBlue fluid level is low; alert details with recurrence and location; Signals info; Map, Comparison, Evidences and Digital twin tabs; and a route map with the selected alert location, a UDS error response, telemetry events, drive segments and an inferred gap
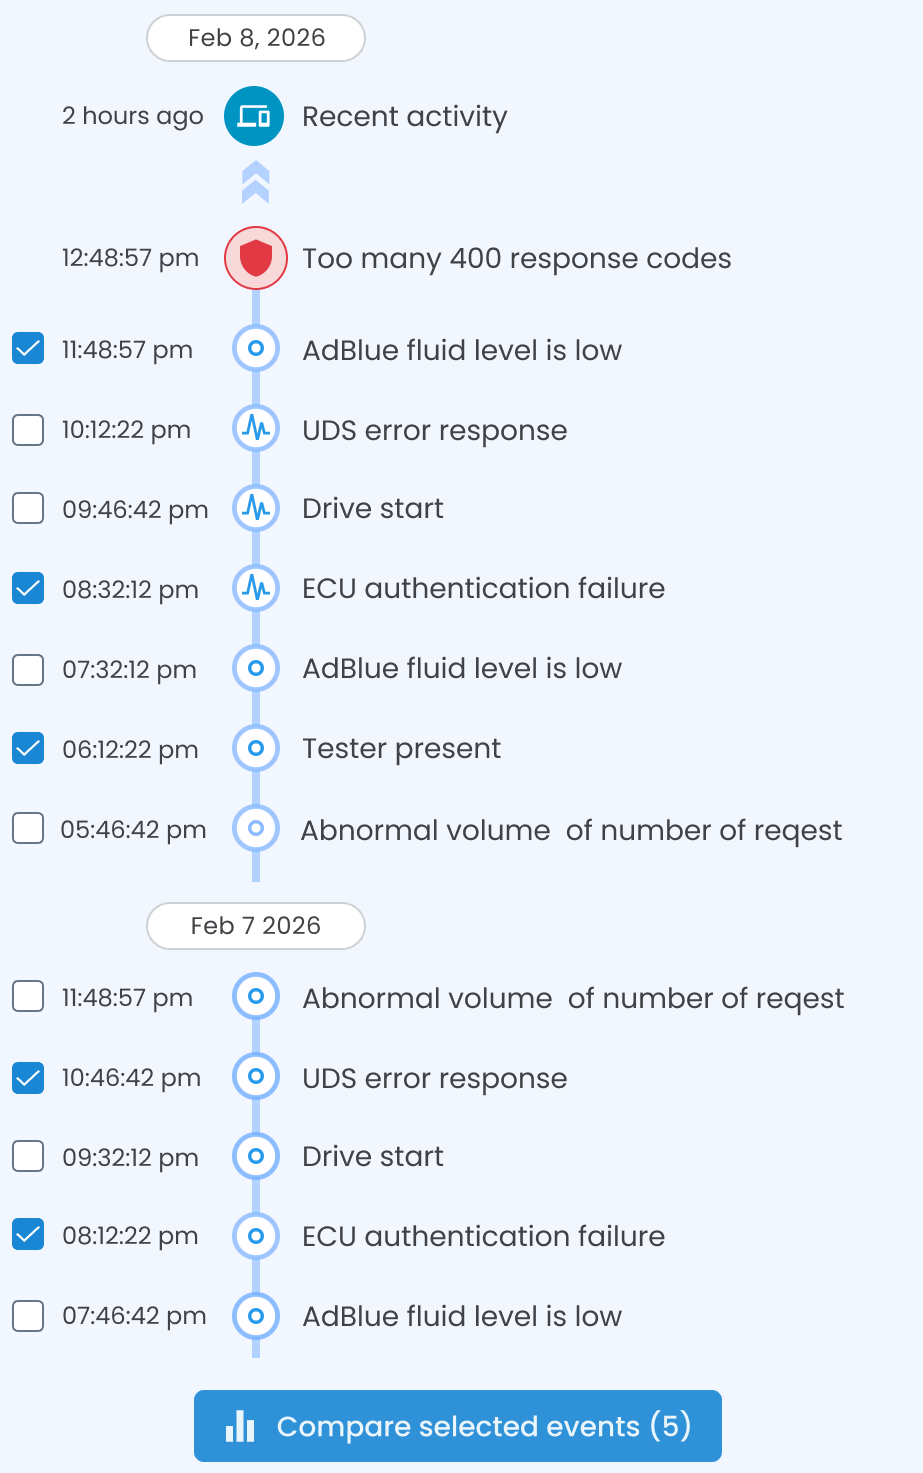
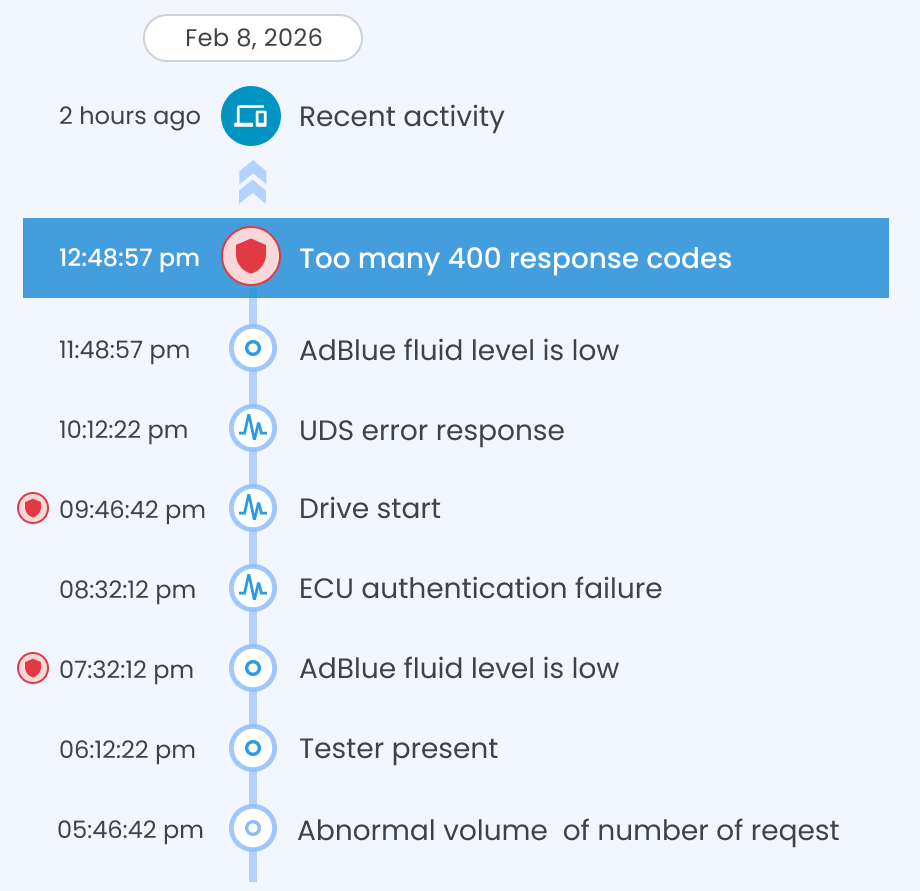
Timeline: the selected alert “Too many 400 response codes” at 12:48:57 pm among surrounding events, with red contributing-event markers beside Drive start at 09:46:42 pm and AdBlue fluid level is low at 07:32:12 pm
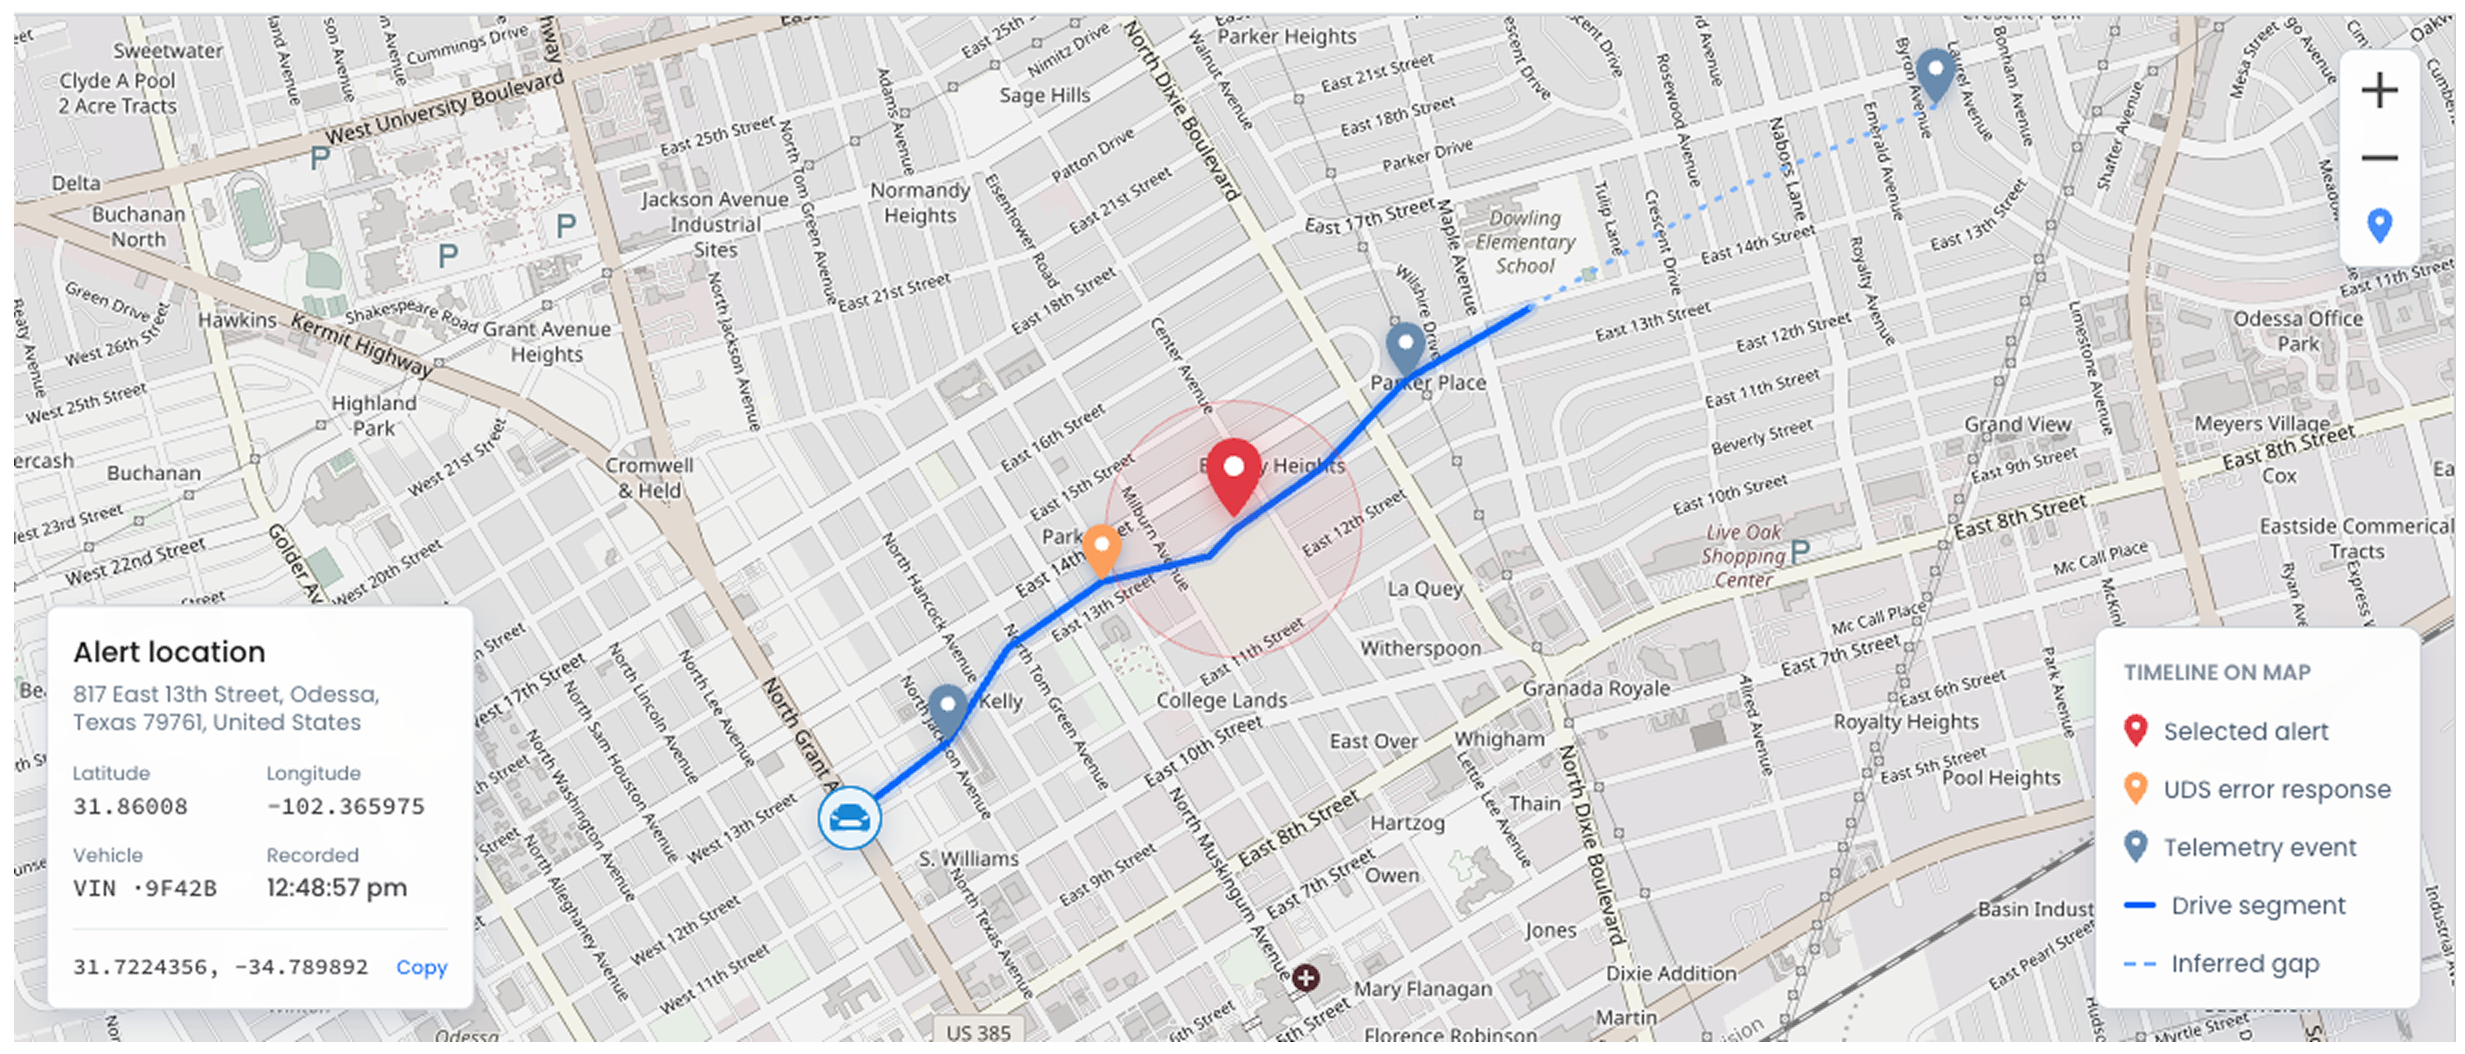
Map: the vehicle route with the selected alert pin, a UDS error response marker and telemetry event markers, the Alert location card and the Timeline on map legend
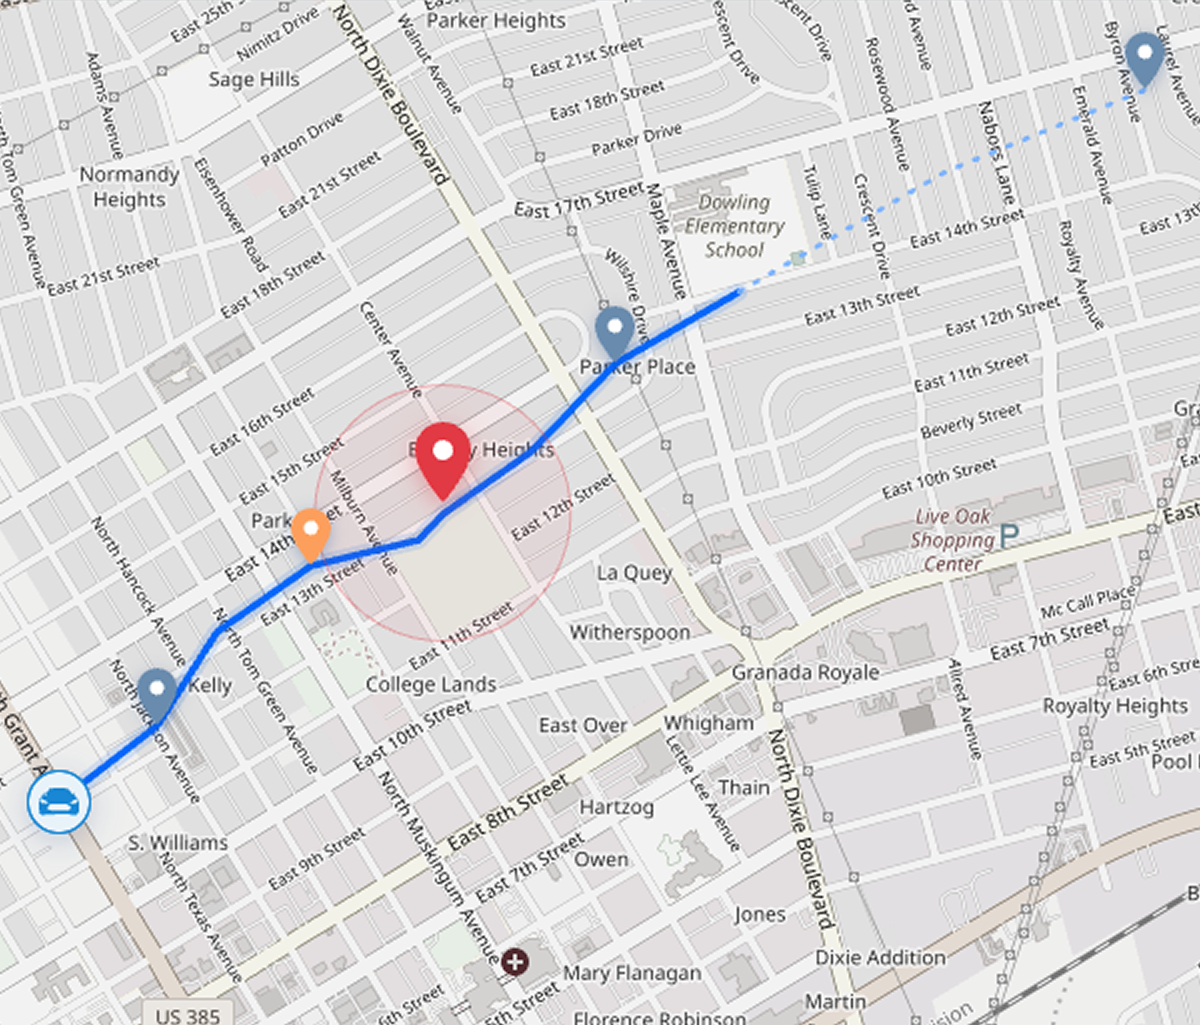
Map: the vehicle route from the vehicle position past telemetry event markers and a UDS error response marker to the selected alert pin
ROLE
Senior Product Designer
DOMAIN
Automotive Cybersecurity
FOCUS
Investigation Workflow & Context
SCOPE
UX Strategy · Information Architecture · Interaction Design · UI
COLLABORATION
Product Managers across multiple product areas

01

CONTEXT

An alert is only the starting point of an investigation.

A security alert sits inside a broader sequence of vehicle activity.

To understand what happened, an analyst may need to reconstruct the events around it, identify which events contributed to the alert, examine where they occurred, compare patterns over time, inspect the detection logic, and understand the wider state of the vehicle.

The challenge was to support those different questions without forcing the analyst to repeatedly leave the investigation and rebuild context elsewhere.

The Timeline became the foundation for a workspace where the investigation remains stable while the analytical lens changes.

02

THE CHALLENGE

Every deeper question risks breaking the investigation context.

A chronological event list can explain when something happened, but it cannot answer the full set of questions an investigation raises.

The experience needed to help analysts understand:

  • What happened before and after the alert?

  • Which events actually contributed to its creation?

  • Where did the activity occur?

  • Which events show correlated behavior or simultaneous spikes?

  • Which detection conditions produced the alert?

  • What other conditions are currently visible in the vehicle?

The design challenge was not to add more information around the timeline.

It was to create a structure that could support several forms of investigation while preserving the same selected alert, vehicle state, and event history throughout.

03

RESEARCH

Aligning investigation needs across the product.

Because the Timeline affected multiple product areas, the research focused on aligning shared investigation needs across the product.

What I needed to understand

  1. 01

    What context must remain visible throughout the investigation?

    Which information should stay stable as the analyst moves from one type of analysis to another?

  2. 02

    Where should deeper investigation branch from the timeline?

    Which questions belong directly in the event sequence, and which require a dedicated analytical view?

  3. 03

    How can different product needs share one investigation model?

    How can spatial analysis, comparison, detector evidence, and vehicle context coexist without becoming disconnected tools?

How I learned

  1. 01

    Joint requirements session

    I worked with the Product Managers in a shared session to understand their investigation needs, priorities, and the questions their product areas needed the Timeline to answer.

  2. 02

    Shared concept review

    I presented the proposed Timeline experience back to the group and used their feedback to identify gaps and refine the investigation structure.

What the discussions converged on

  1. 01

    Investigation context should remain persistent

    The analyst should not have to reconstruct the selected alert or vehicle state each time they switch analytical views.

  2. 02

    Chronology alone is not enough

    The sequence needs to distinguish ordinary surrounding activity from the events that actually contributed to the selected alert.

  3. 03

    Different questions require different analytical lenses

    Location, correlation, detector logic, and vehicle state cannot be compressed into one visualization without reducing clarity.

  4. 04

    Deeper analysis should branch from the same timeline

    The Timeline should remain the common entry point and orientation layer rather than becoming another isolated tool.

RESEARCH DIRECTION

FROM

Event history + separate investigation views

TO

One investigation context → Multiple analytical lenses

04

KEY PRODUCT DECISIONS

Keep the investigation stable while changing the way it is examined.

DECISION 01

Turn the timeline into the investigation spine

PROBLEM

A simple chronological list helps reconstruct sequence, but it does not show which events matter to the alert being investigated.

Moving into deeper tools can also make it easy to lose the original context.

DECISION

Keep the Timeline permanently visible alongside the selected alert and the vehicle’s Signals info.

Within the sequence, distinguish the events that actually contributed to the selected alert using dedicated red markers.

The analyst can therefore see both the surrounding activity and the contributing chain in the same chronology.

RATIONALE

The Timeline becomes more than navigation.

It provides a persistent frame of reference for the entire investigation.
DECISION 02

Connect the event sequence to where it happened

PROBLEM

Time alone does not explain the spatial relationship between events.

An analyst may need to understand where an alert occurred, what happened along the route, and how surrounding activity relates to it.

DECISION

Add a Map lens that places the selected alert and other timeline events directly onto the vehicle route.

The view includes:

  • selected alert location
  • related event markers
  • route segments
  • event details
  • location and vehicle context

The Timeline, alert details, and Signals info remain visible while the map changes the perspective from chronological to spatial.

RATIONALE

The analyst can move from:

when something happened

to:

where and in what sequence

without leaving the investigation.

DECISION 03

Turn timeline events into a comparison set

PROBLEM

Some relationships become visible only when several events are examined together.

A chronological list makes it difficult to see whether activity rises at the same time or crosses meaningful thresholds.

DECISION

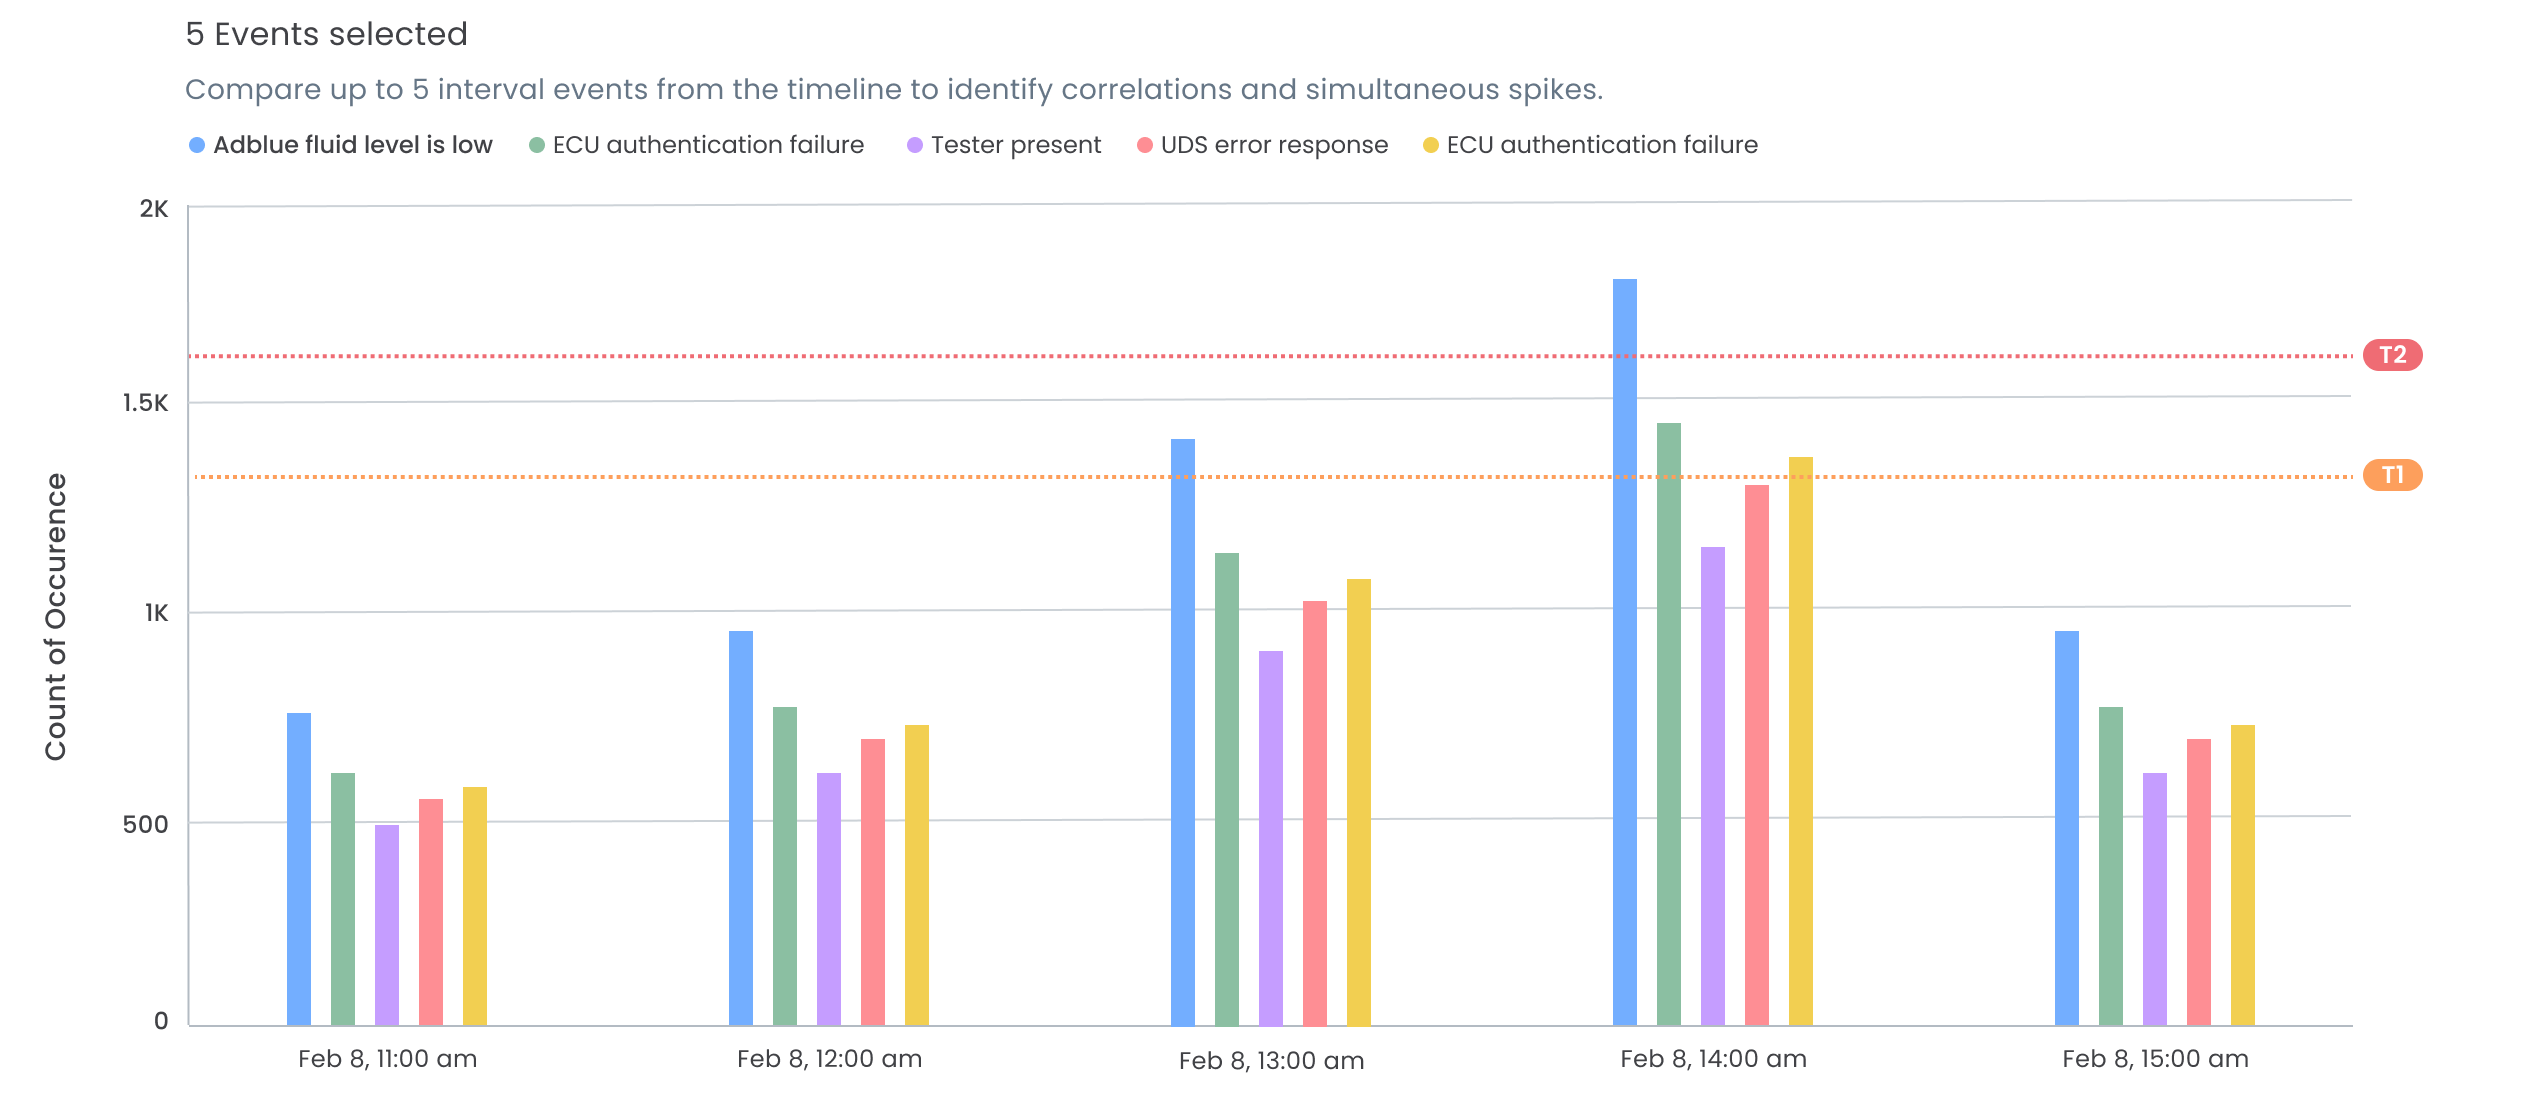
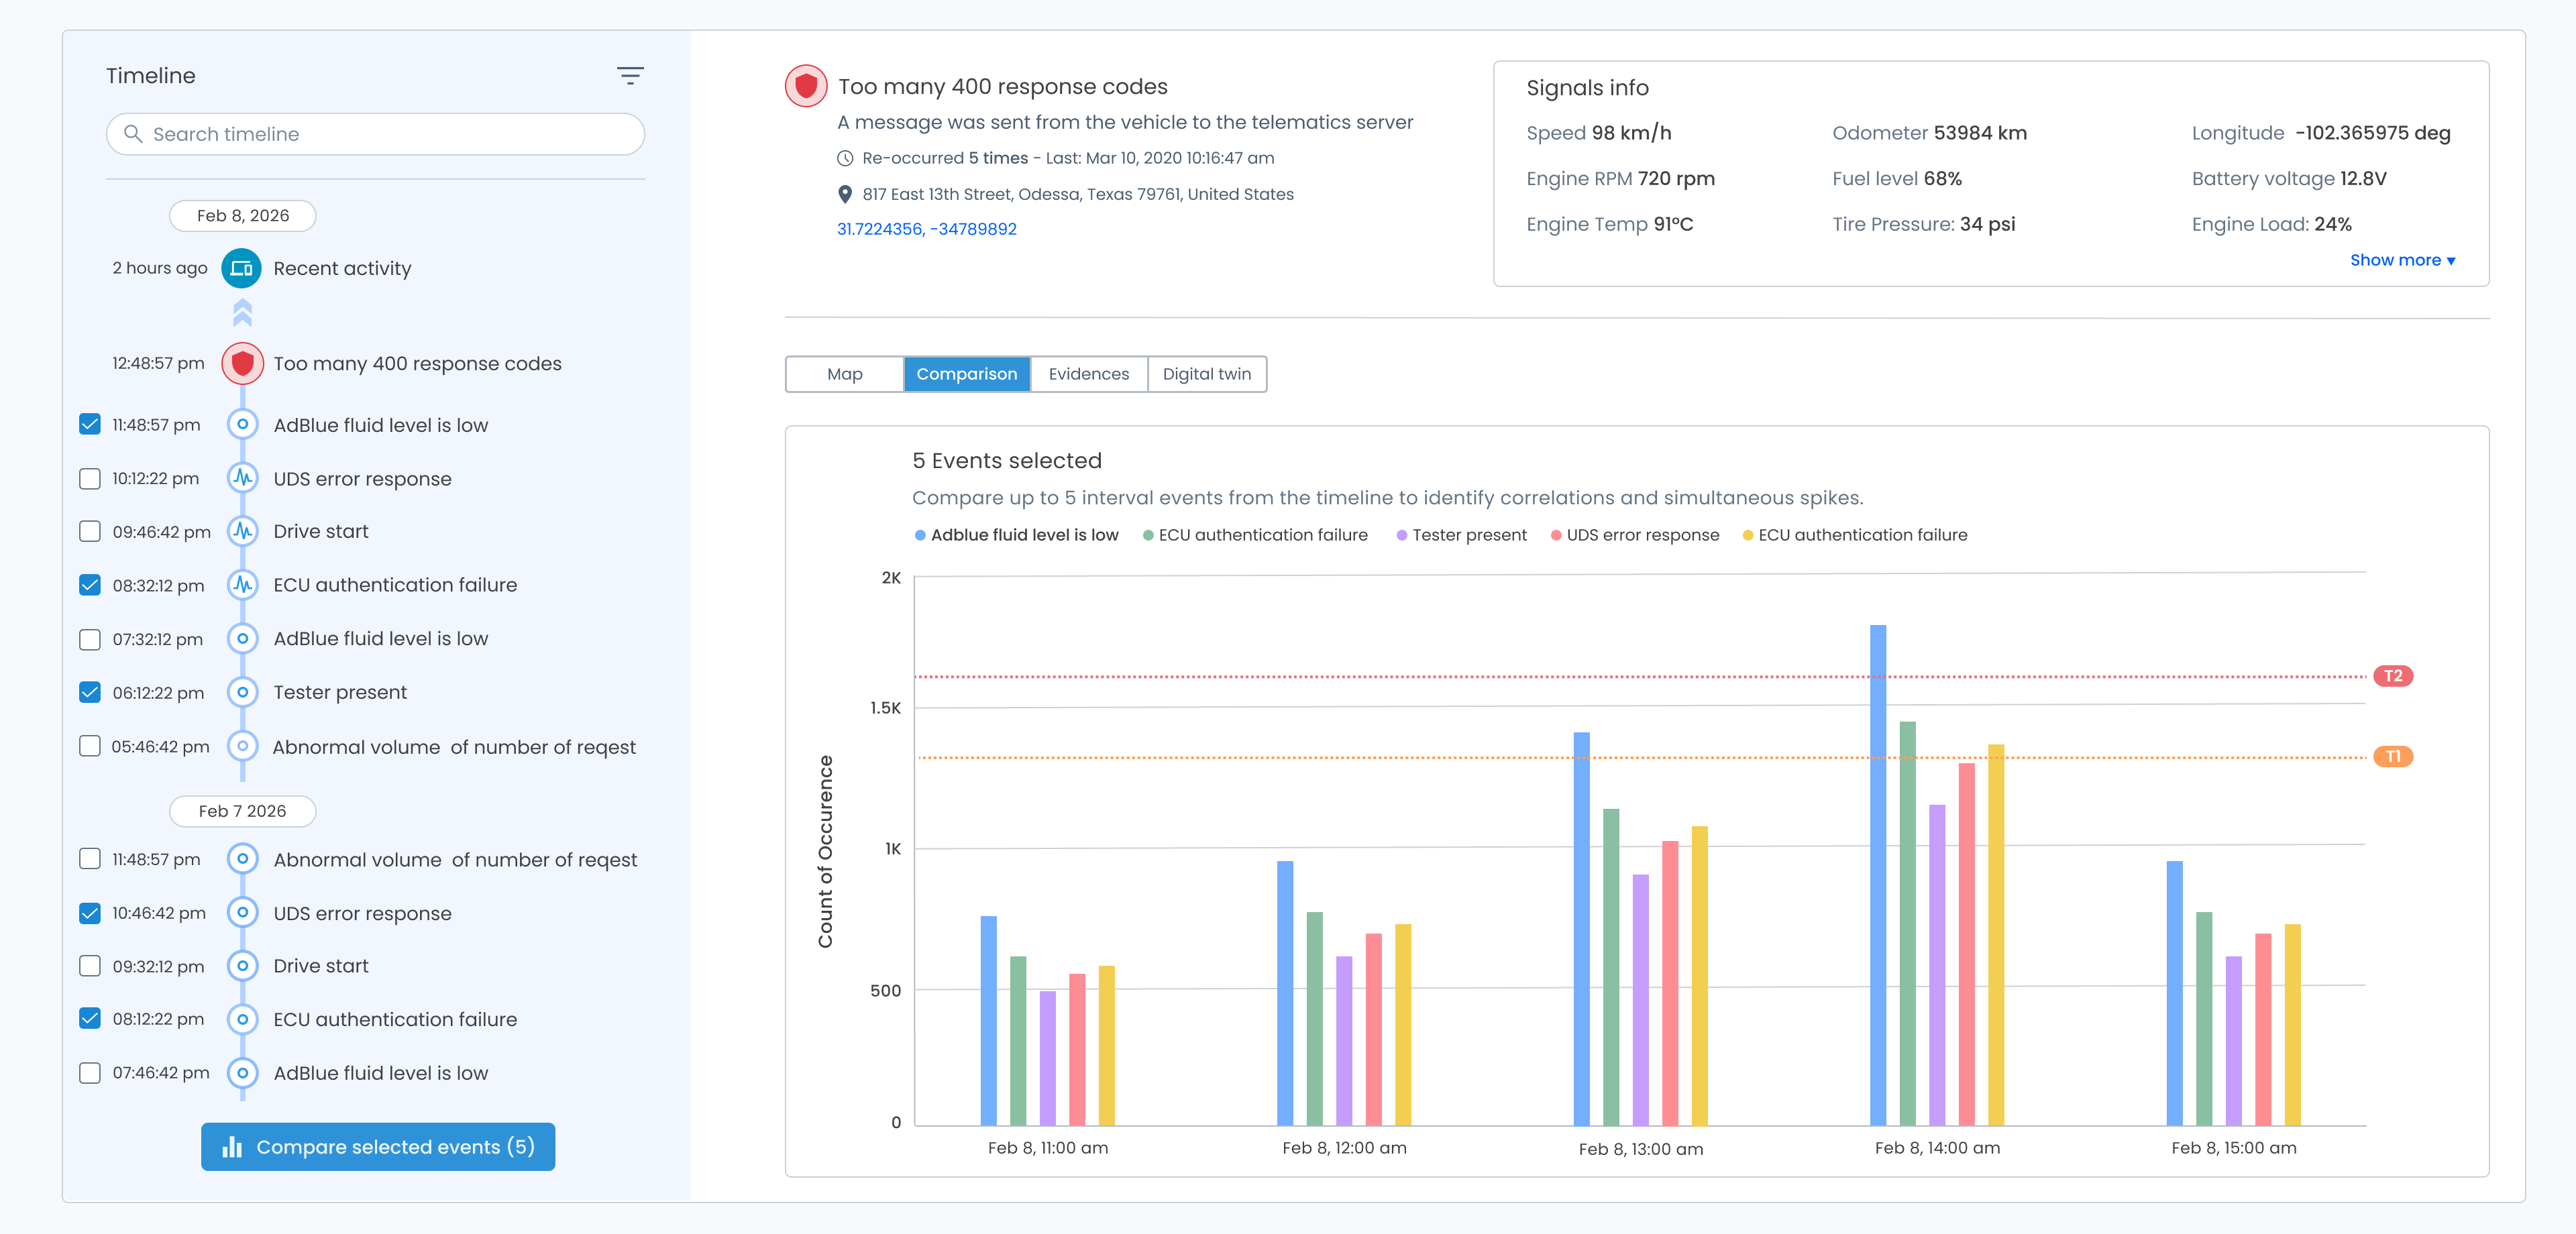
Allow the analyst to select up to five interval events directly from the Timeline and compare them in a shared temporal view.

Each selected event is represented consistently across the chart, while reference thresholds provide additional context for interpreting spikes.

RATIONALE

The same Timeline used for navigation becomes an analytical selection tool.

The analyst can move from:

“These events happened near each other.”

to:

“Did their behavior change together?”

Investigation Timeline, Comparison view: five interval events checked in the Timeline with “Compare selected events (5)”, and a chart comparing their count of occurrence across five hourly intervals on Feb 8 against T1 and T2 thresholds
Timeline selection: five interval events checked — AdBlue fluid level is low, ECU authentication failure, Tester present, UDS error response and ECU authentication failure — with Compare selected events (5)
5 Events selected: legend for the five events and a chart of count of occurrence from Feb 8, 11:00 to 15:00 with T1 and T2 thresholds
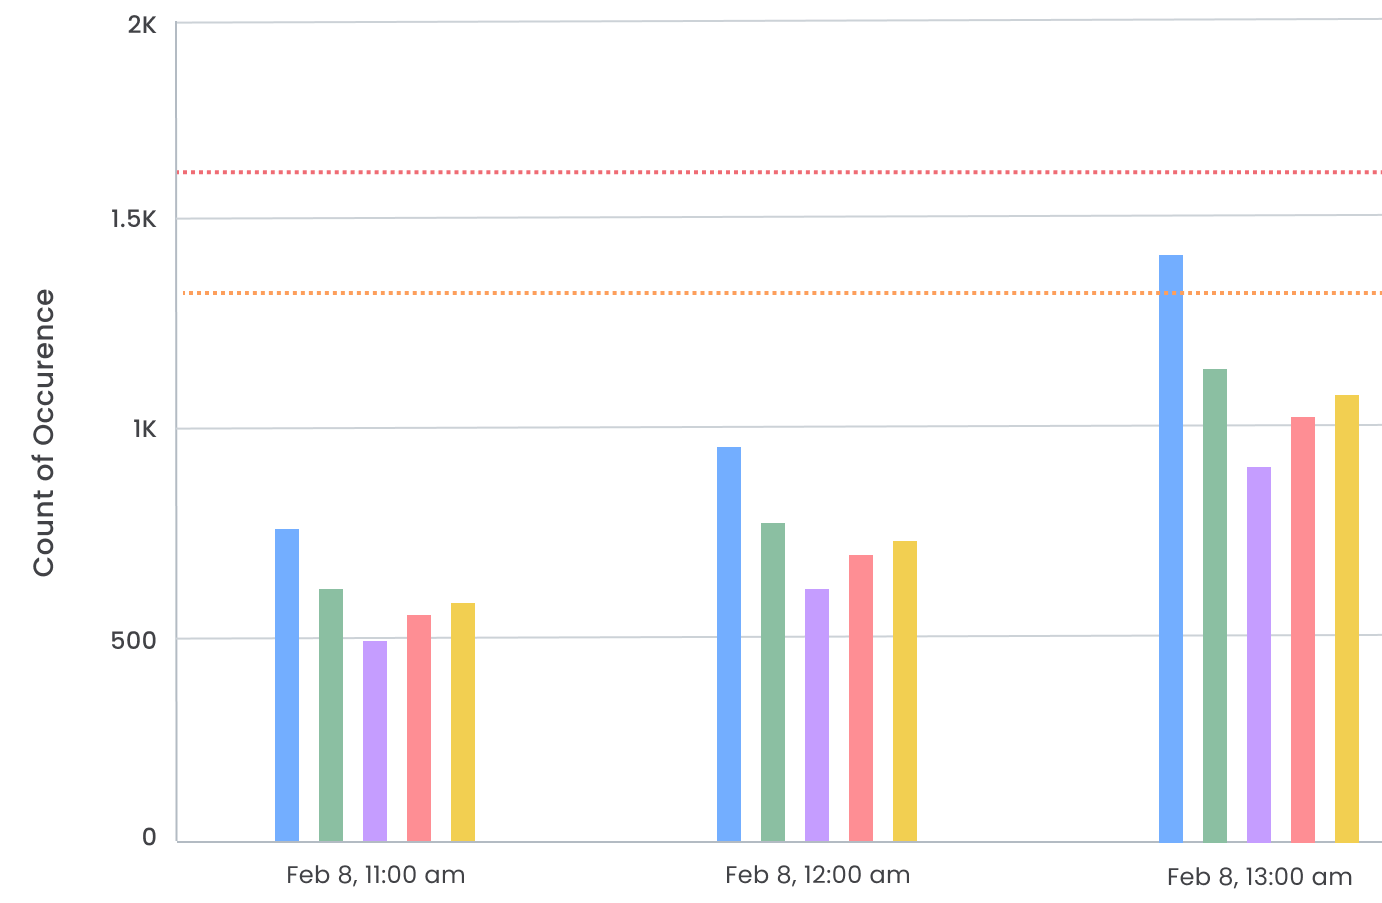
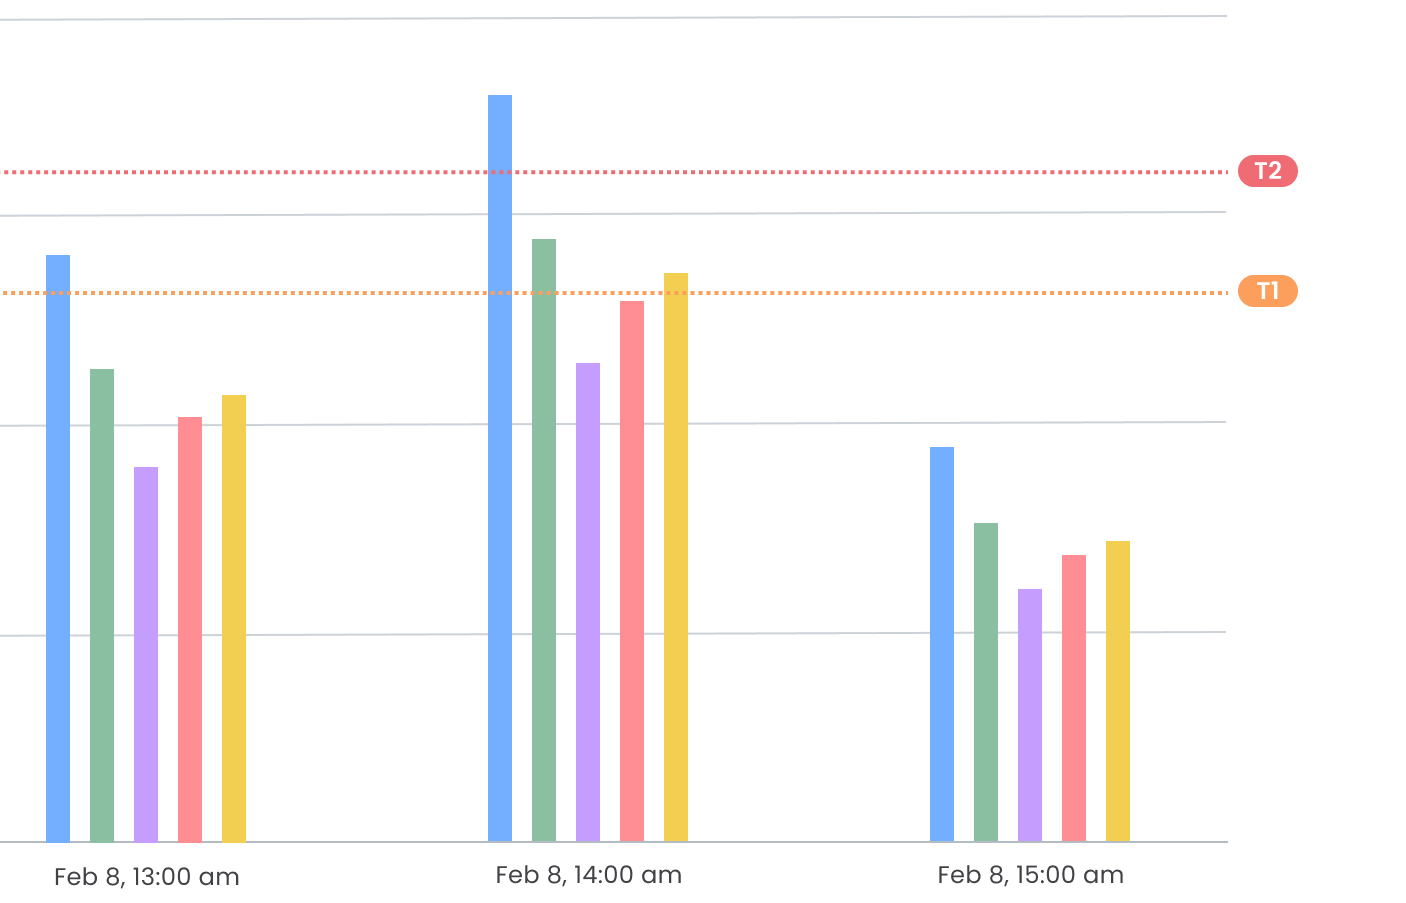
Comparison chart, earlier range: Feb 8, 11:00, 12:00 and 13:00, with the T1 and T2 threshold linesComparison chart, later range: Feb 8, 13:00, 14:00 and 15:00, with the T1 and T2 thresholds labelled

DECISION 04

Explain why the alert fired, not only when it appeared

PROBLEM

Event history and correlation can show what happened around an alert, but they do not explain the detection logic itself.

DECISION

Add an Evidence lens that exposes Logic & performance.

The analyst can inspect:

  • conditions behind the detection
  • AND / OR relationships
  • source and signal
  • data point or interval
  • operator and value
  • Hits
  • Hit rate

This makes it possible to distinguish frequently matching conditions from branches with little or no activity.

RATIONALE

The investigation moves from observing the alert to understanding the rule structure that produced it.

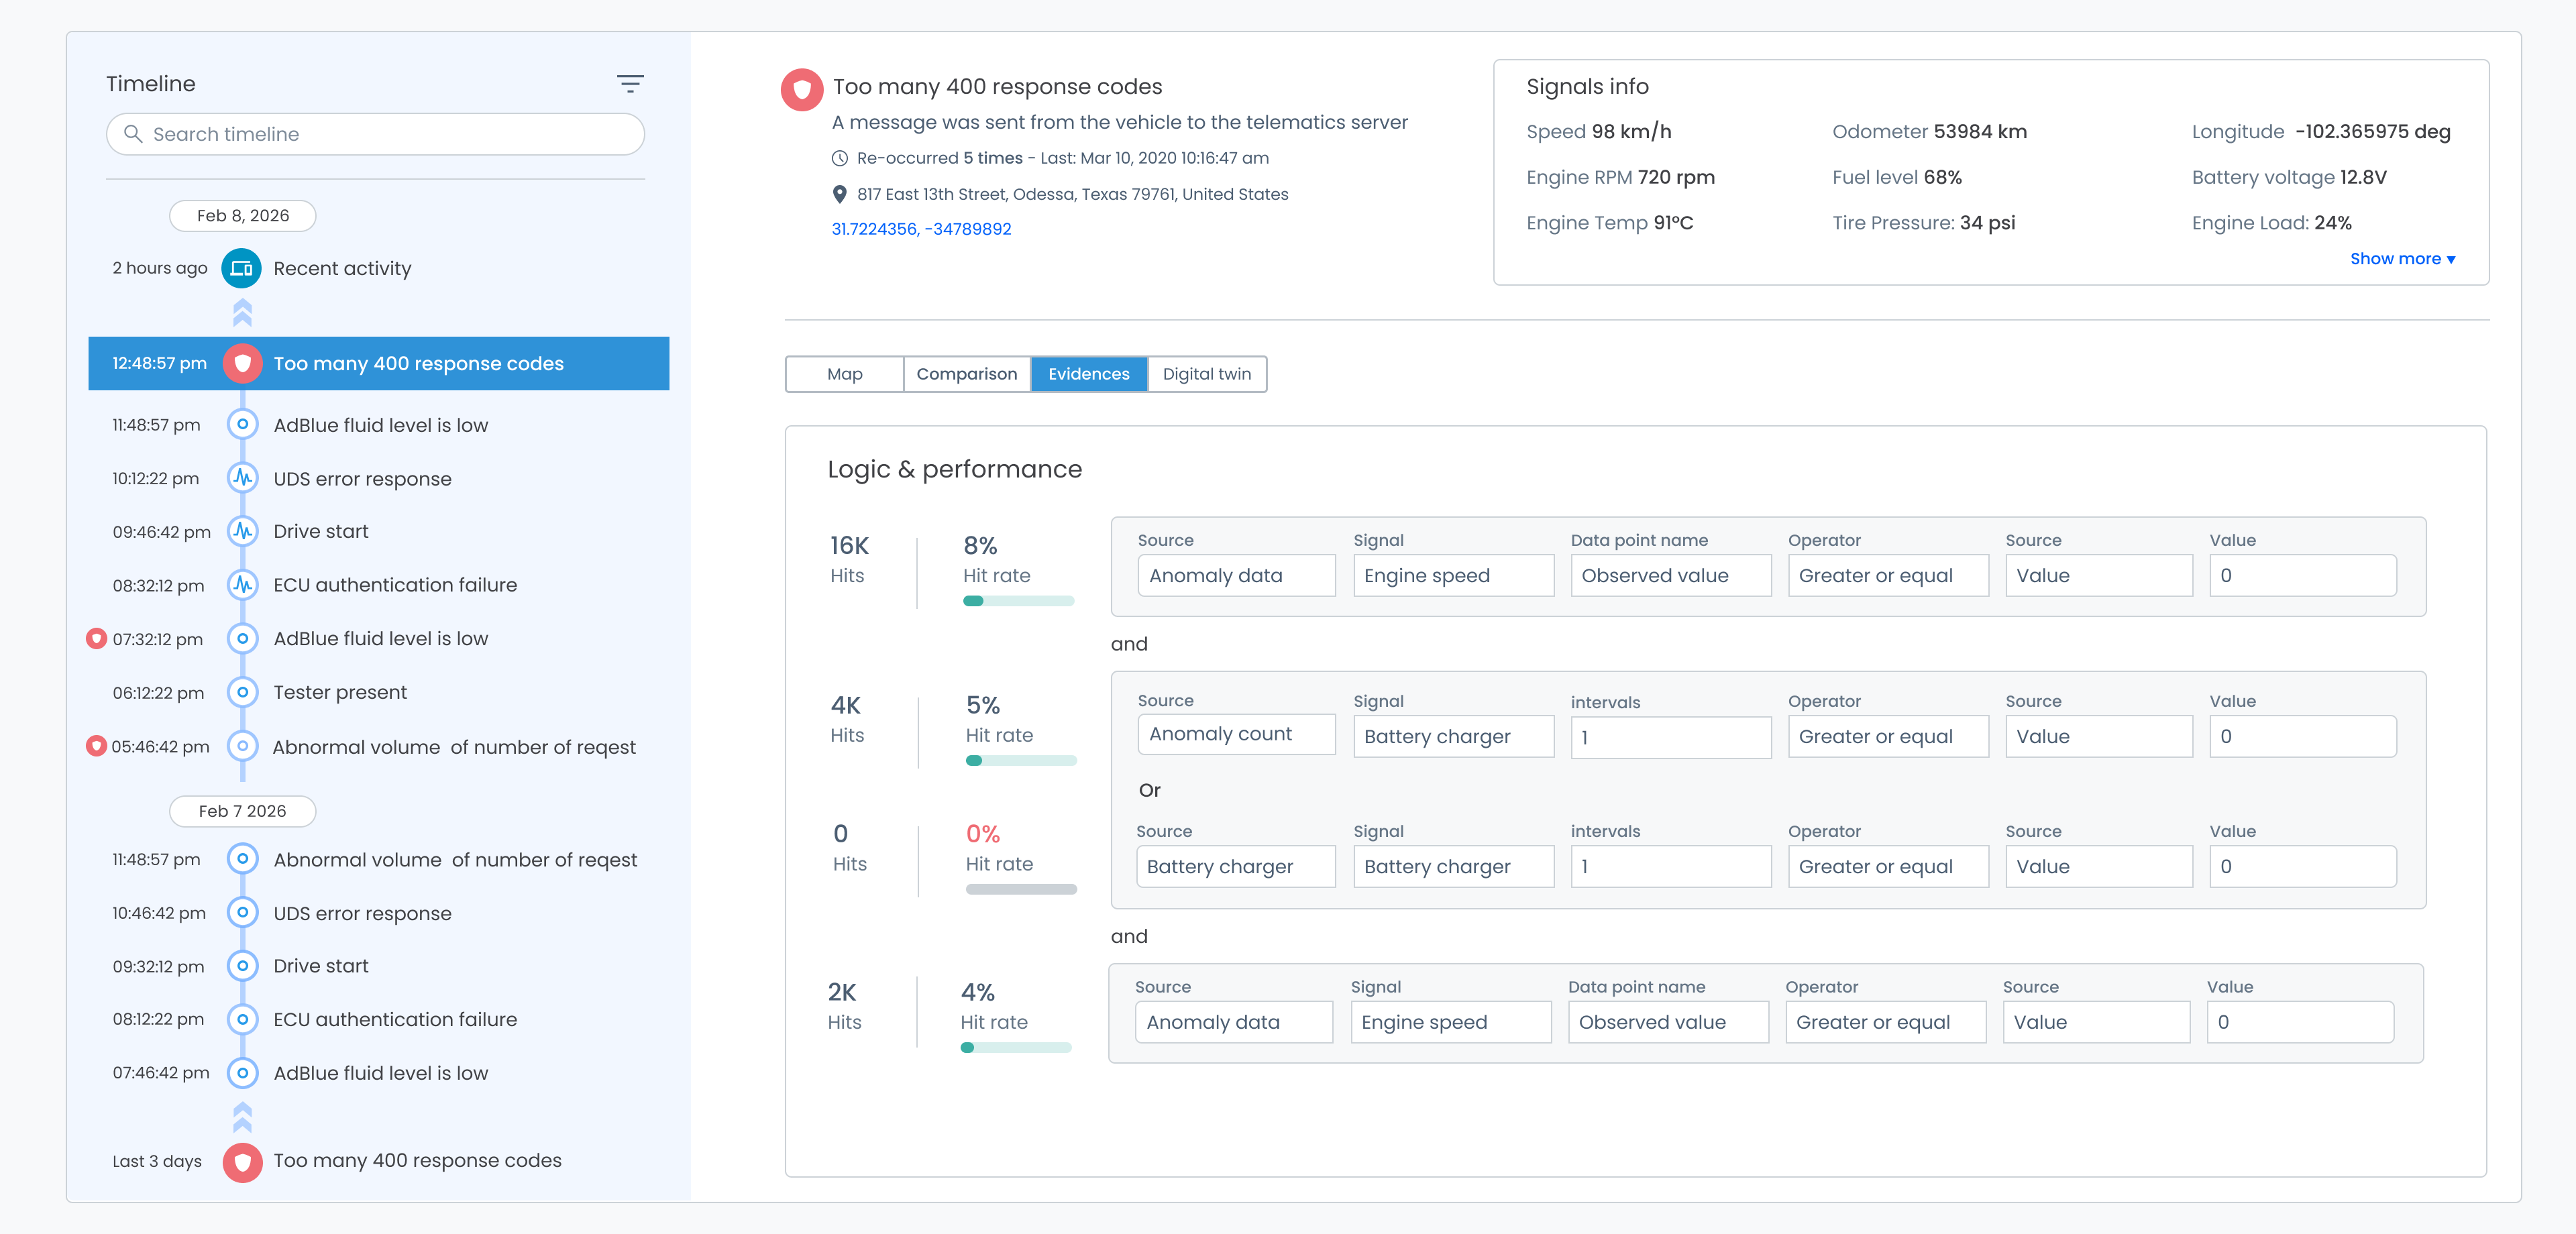
Investigation Timeline, Evidences view: Logic & performance showing detection conditions joined by and / or, each with source, signal, data point or interval, operator and value, and Hits and Hit rate from 16K hits at 8% to 0 hits at 0%
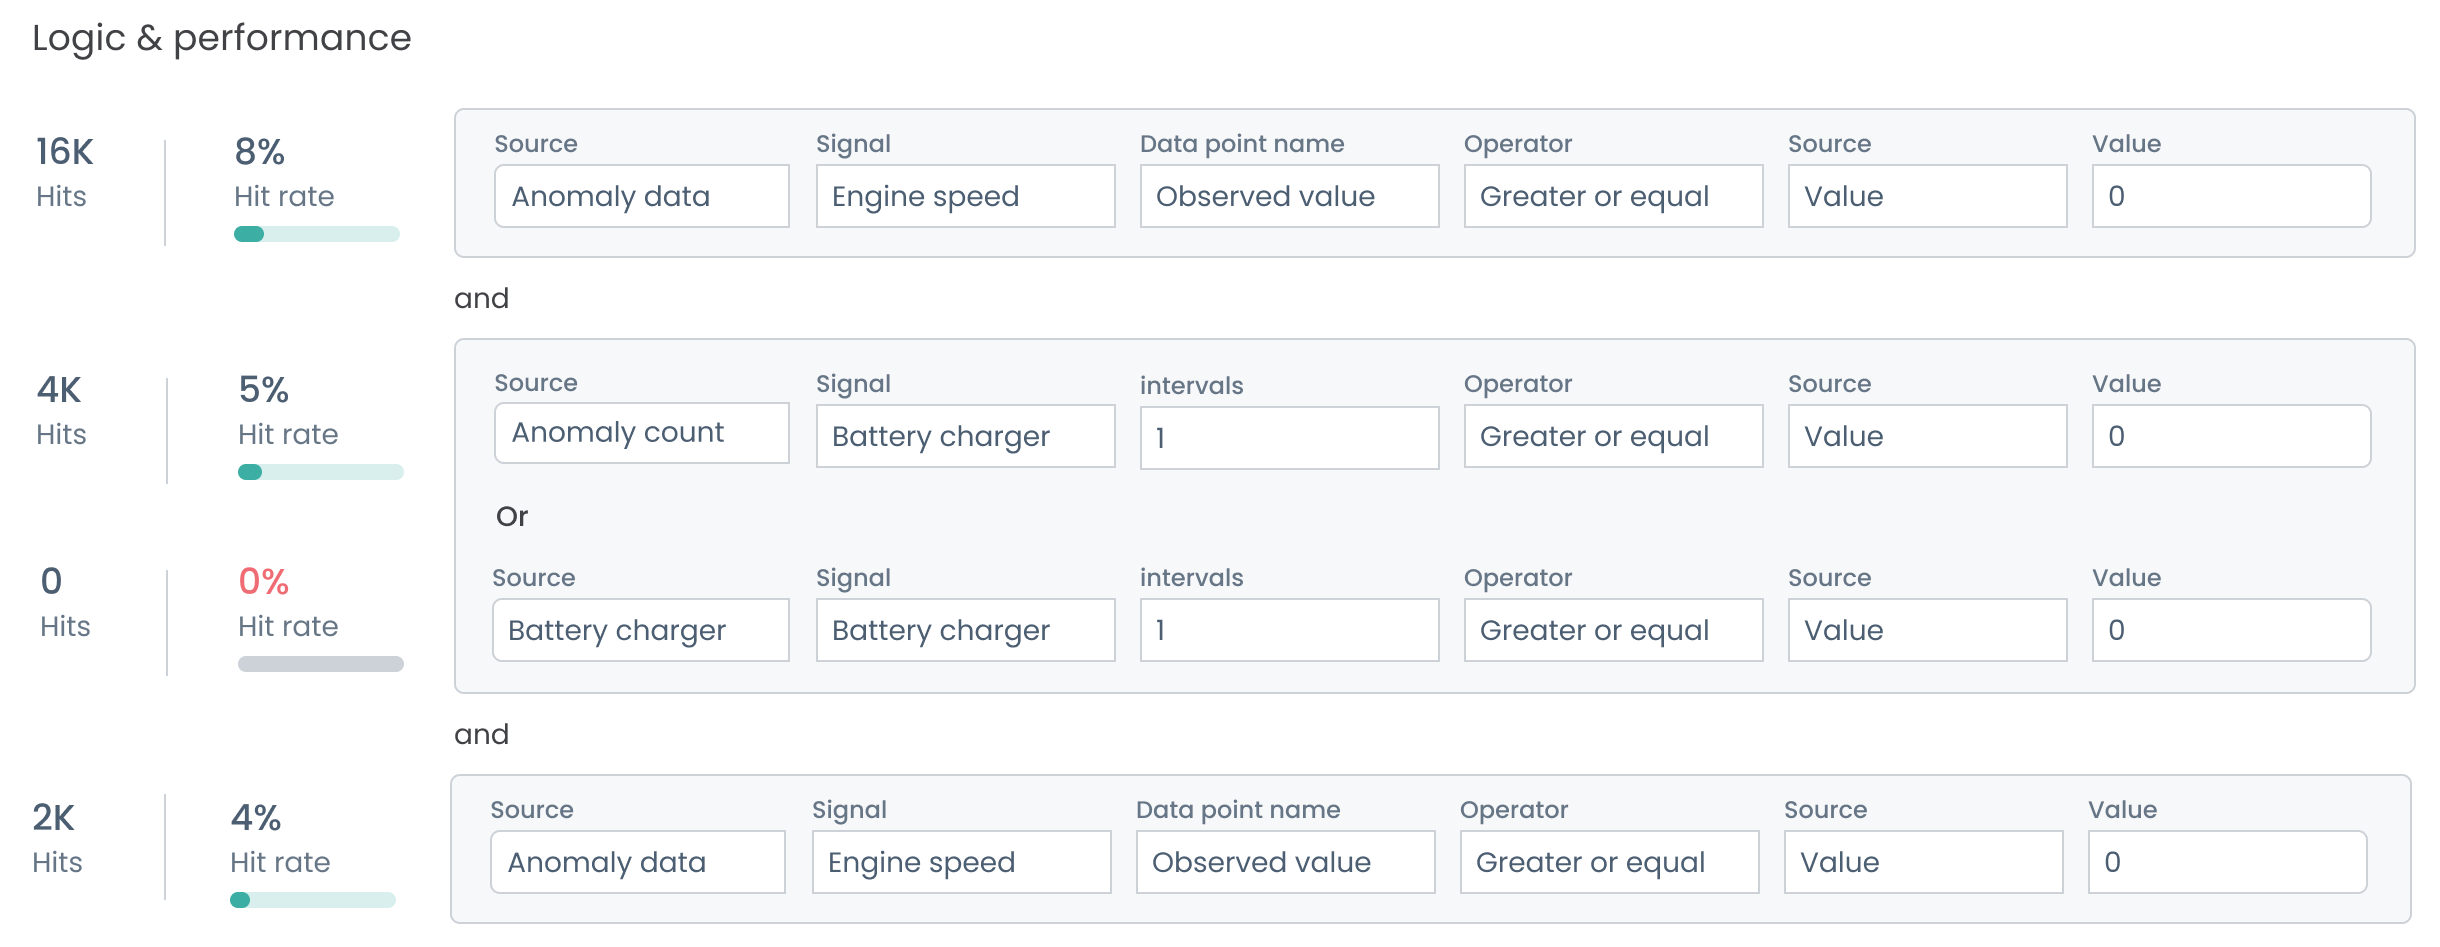
Logic & performance: three condition groups joined by and, the middle group with an Or branch; each condition shows Hits and Hit rate — 16K / 8%, 4K / 5%, 0 / 0%, 2K / 4% — with source, signal, data point or interval, operator, source and value
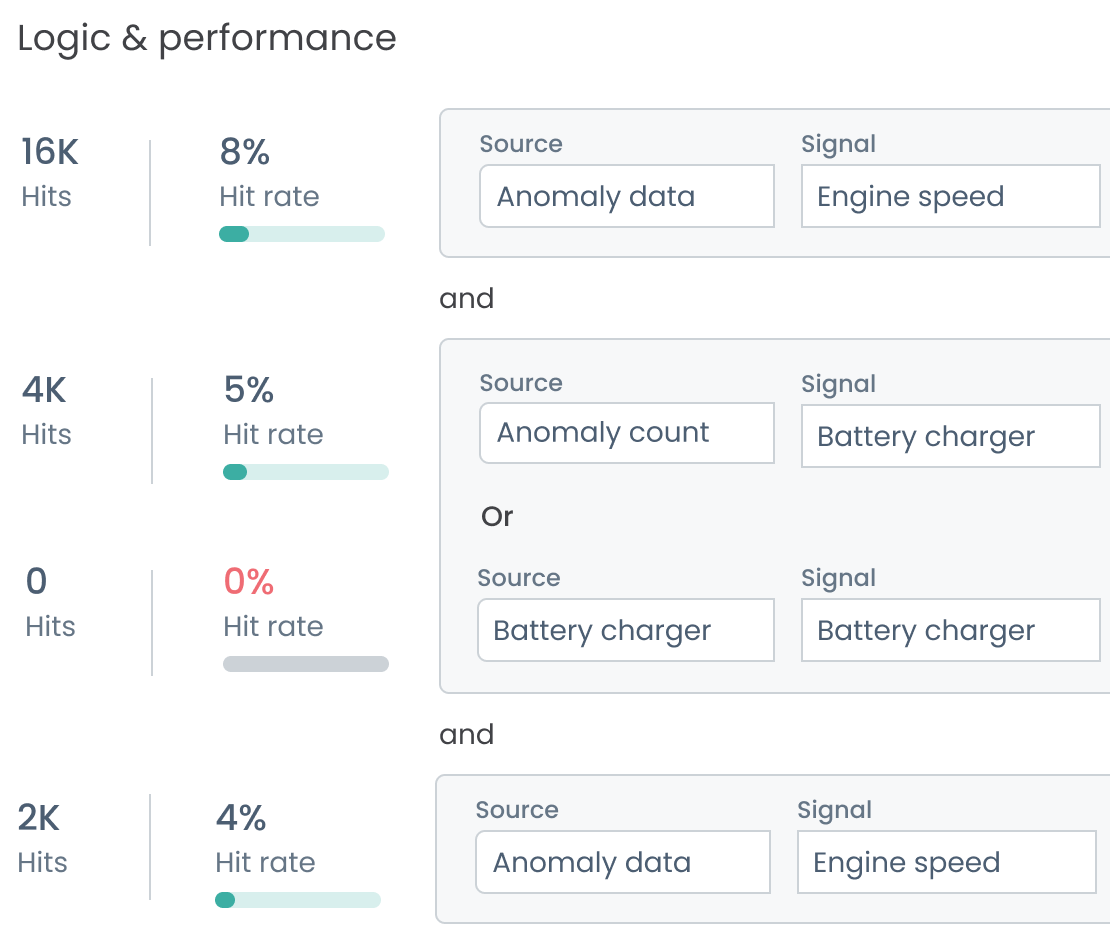
Logic & performance: Hits and Hit rate for each condition — 16K / 8%, 4K / 5%, 0 / 0%, 2K / 4% — with the and / Or structure and each condition’s source and signal

DECISION 05

Expand the investigation beyond the selected alert

PROBLEM

An alert may be only one expression of the vehicle’s wider state.

The analyst may need additional context without abandoning the active investigation.

DECISION

Add a Digital Twin lens containing a searchable view of detected vehicle conditions.

Each condition exposes:

  • name
  • last occurrence
  • category
  • confidence

RATIONALE

The analyst can broaden the investigation into other vehicle conditions while keeping the same alert and Timeline context visible.

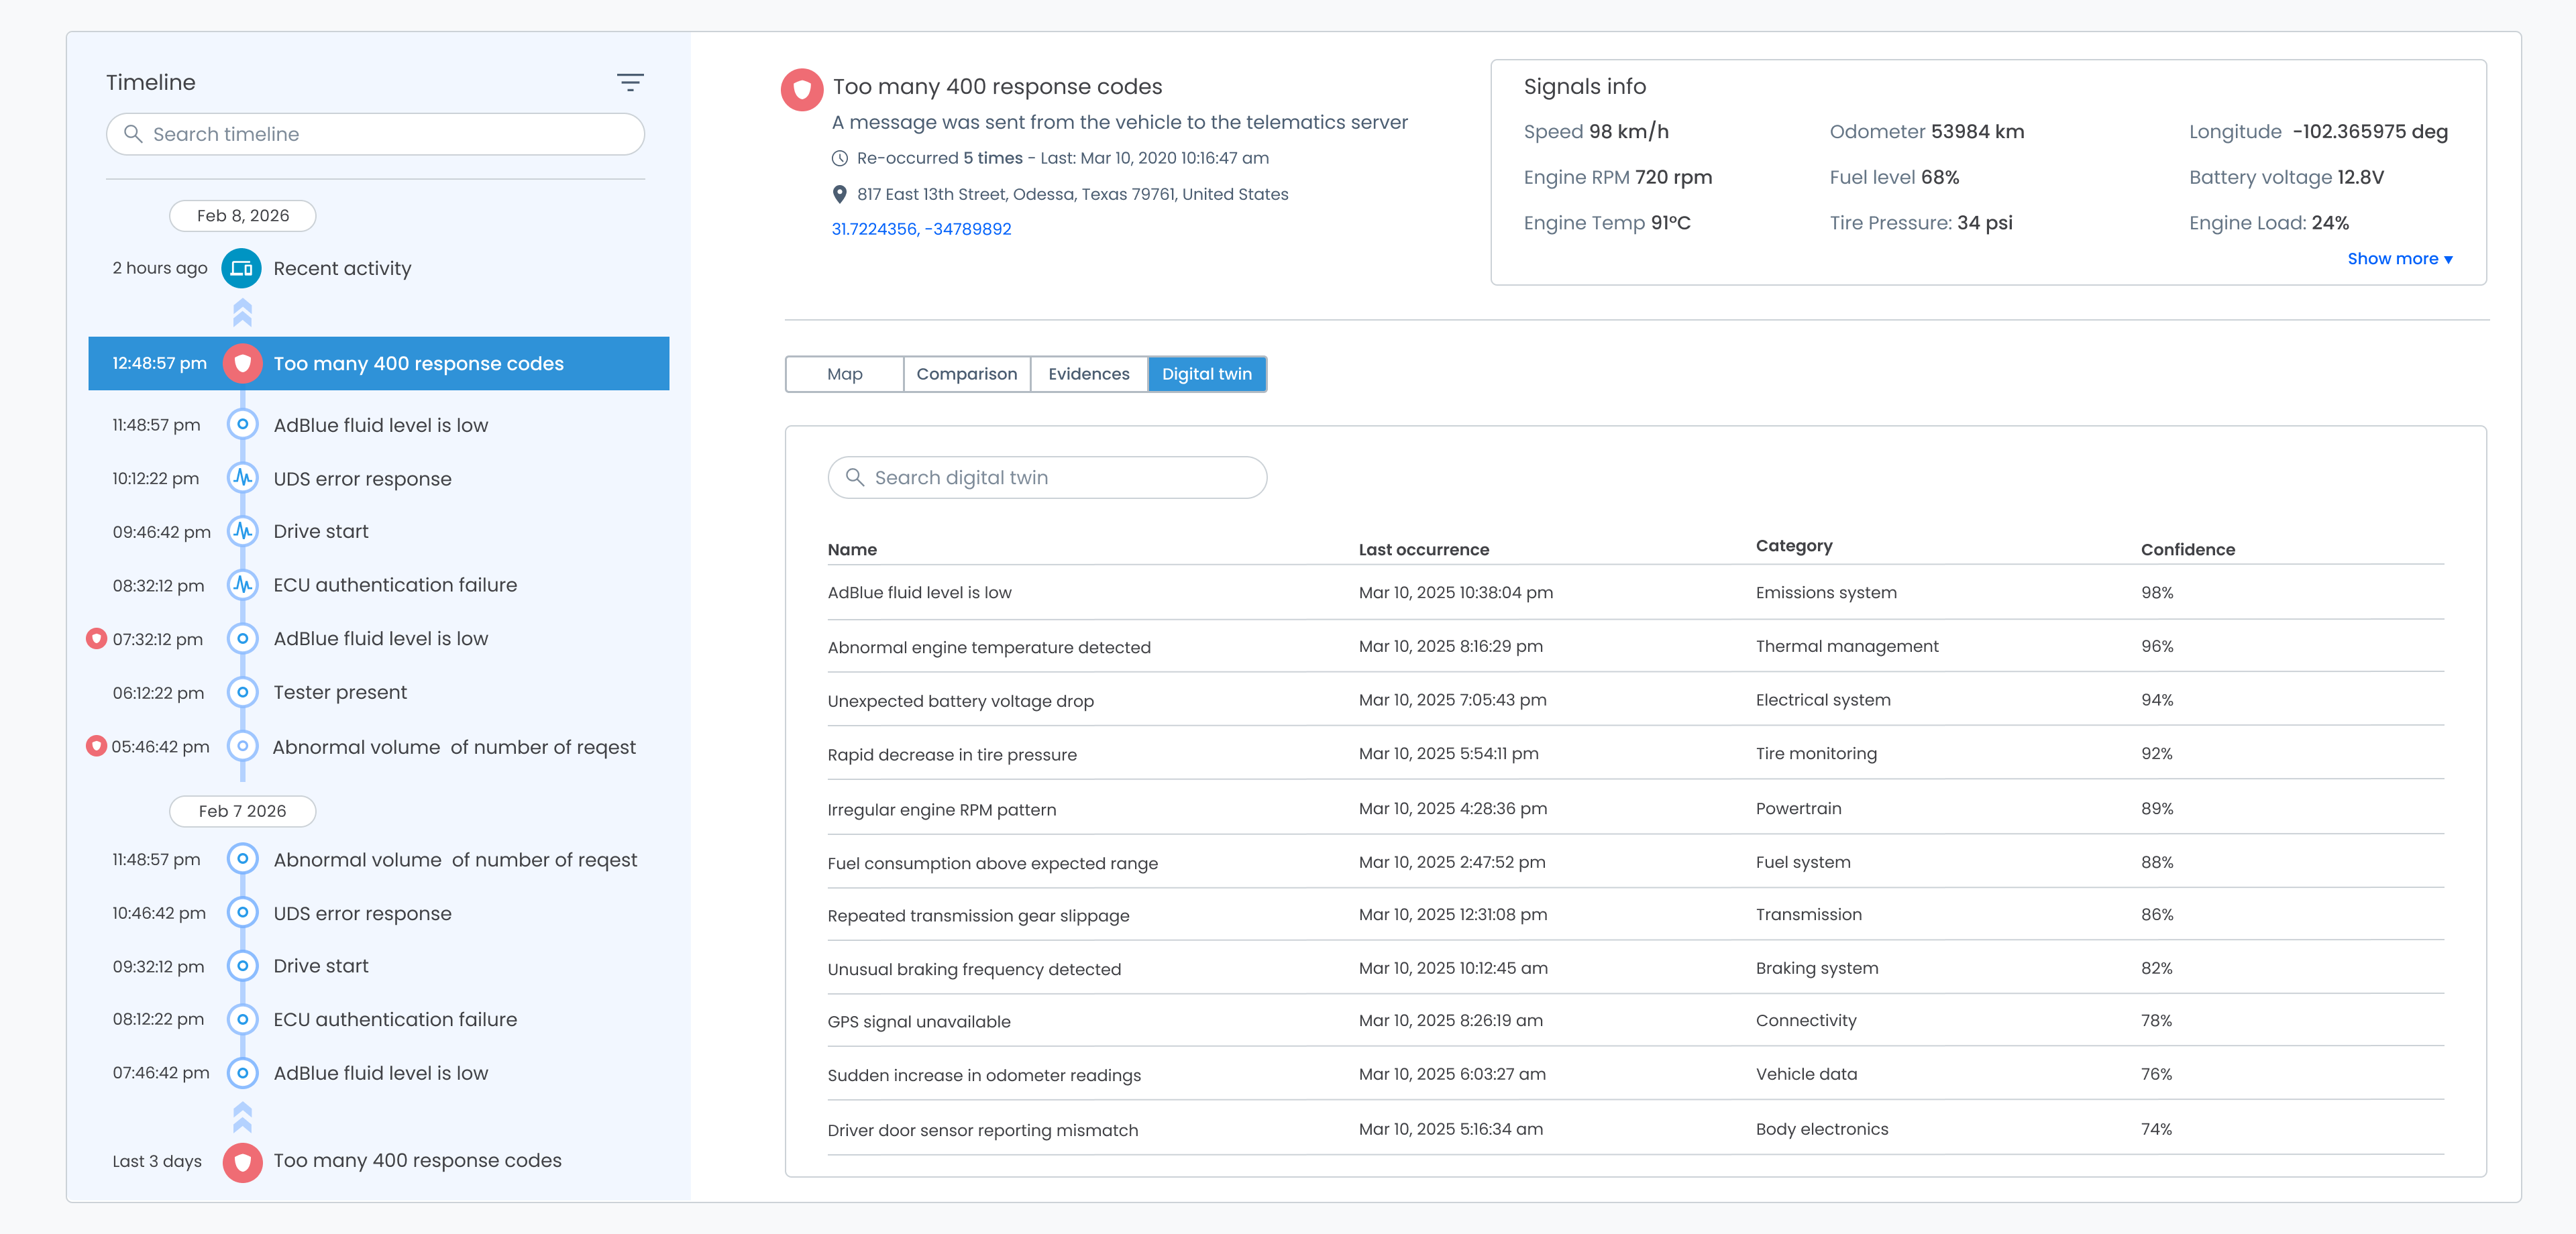
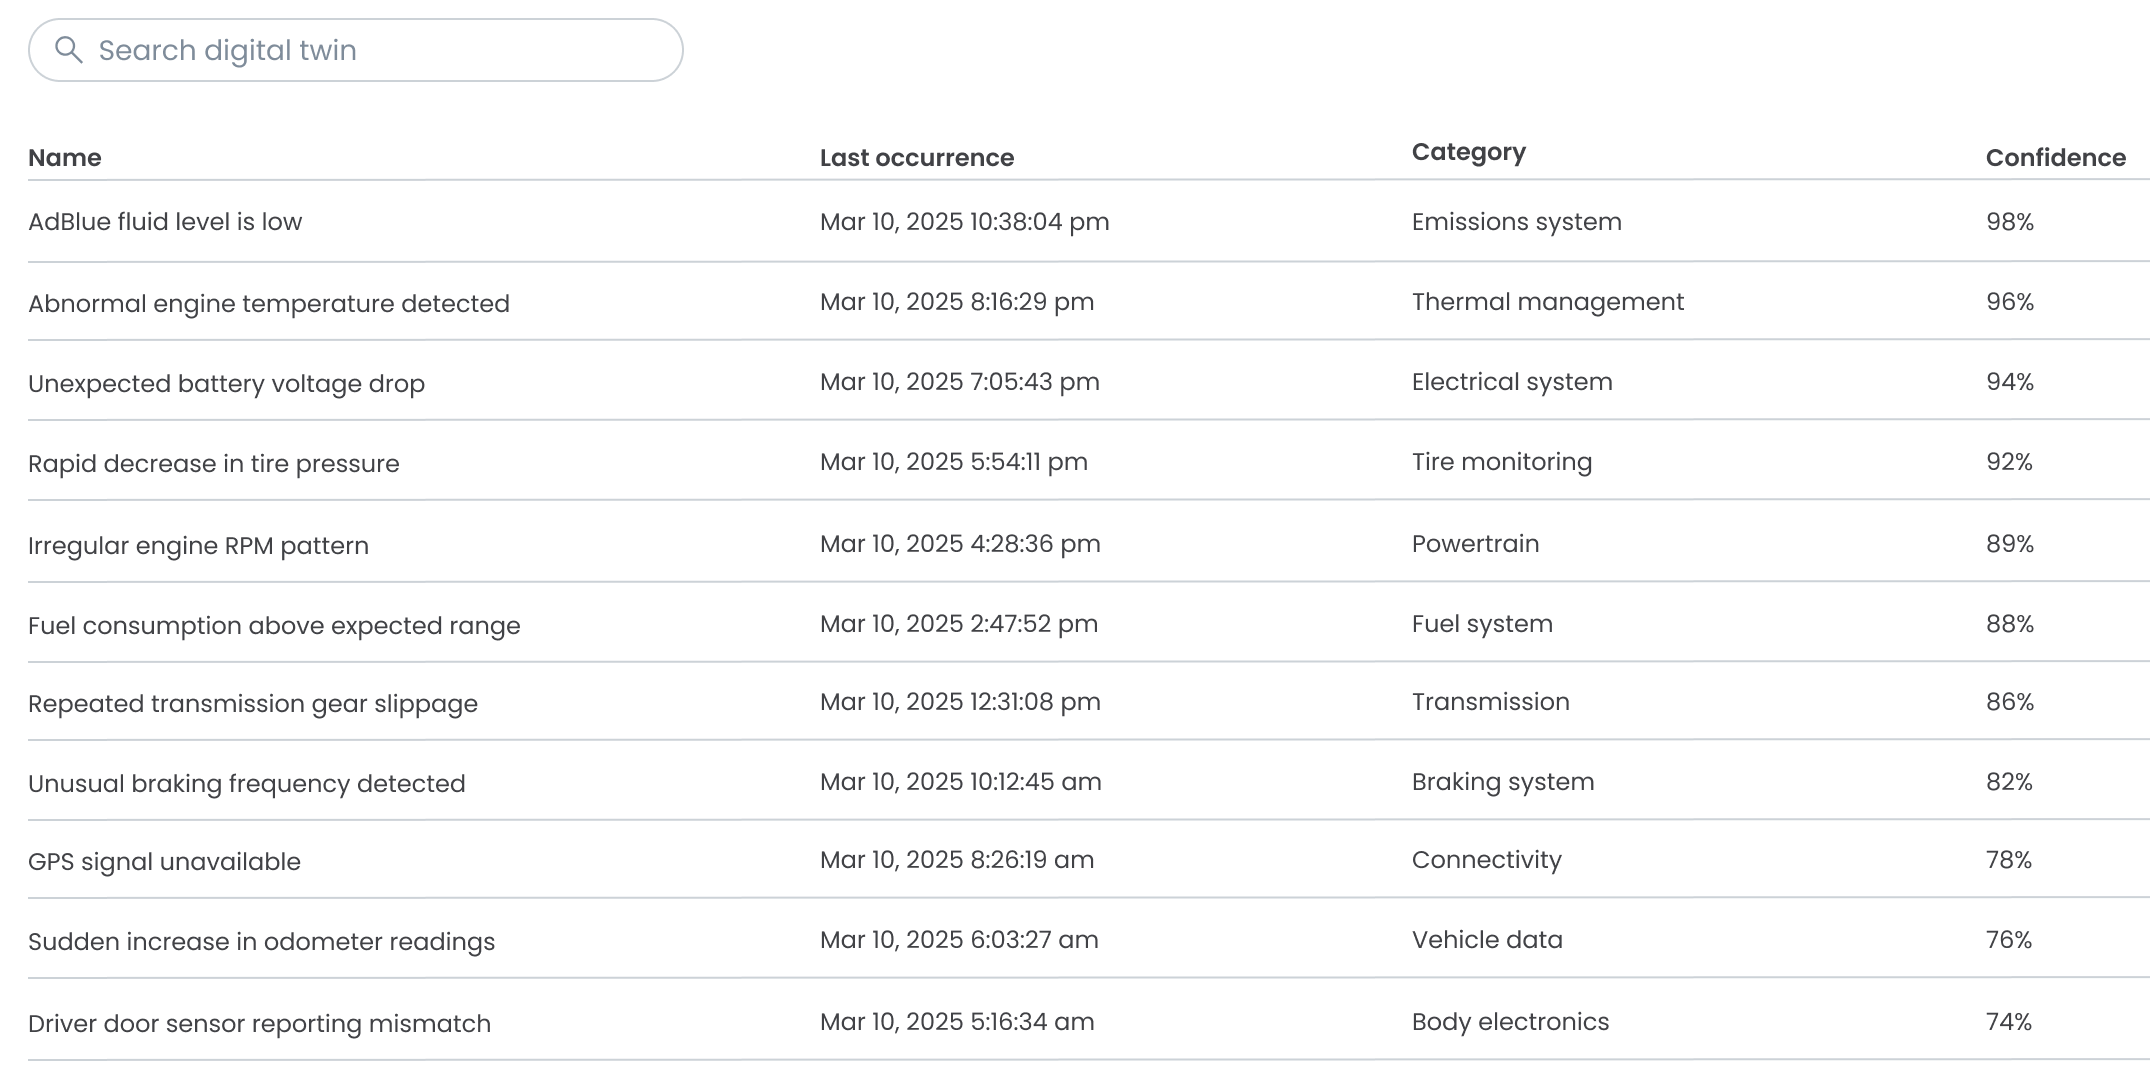
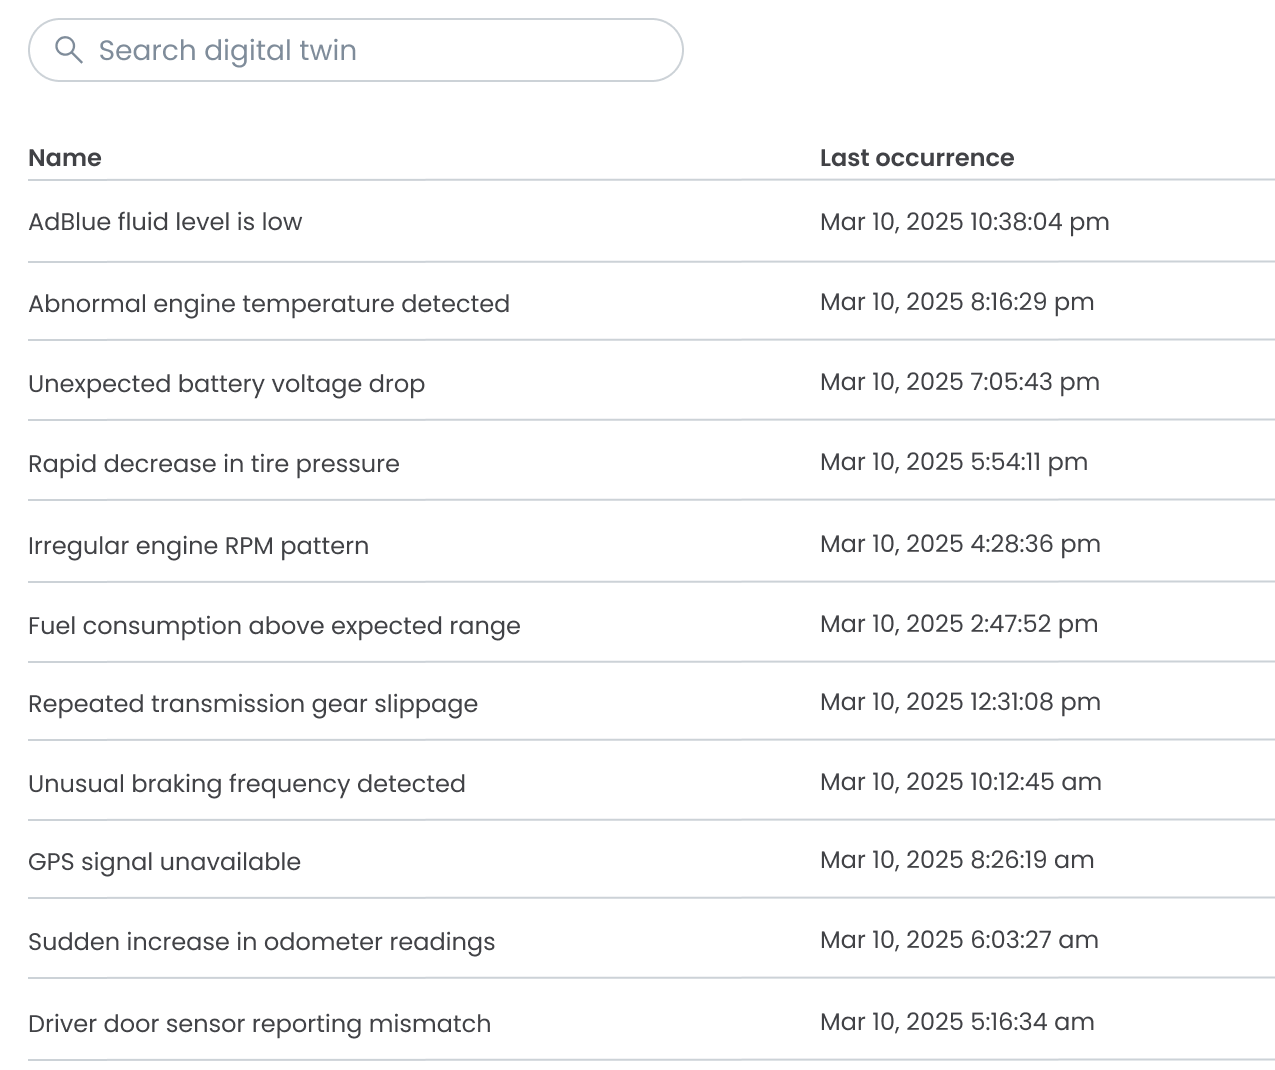
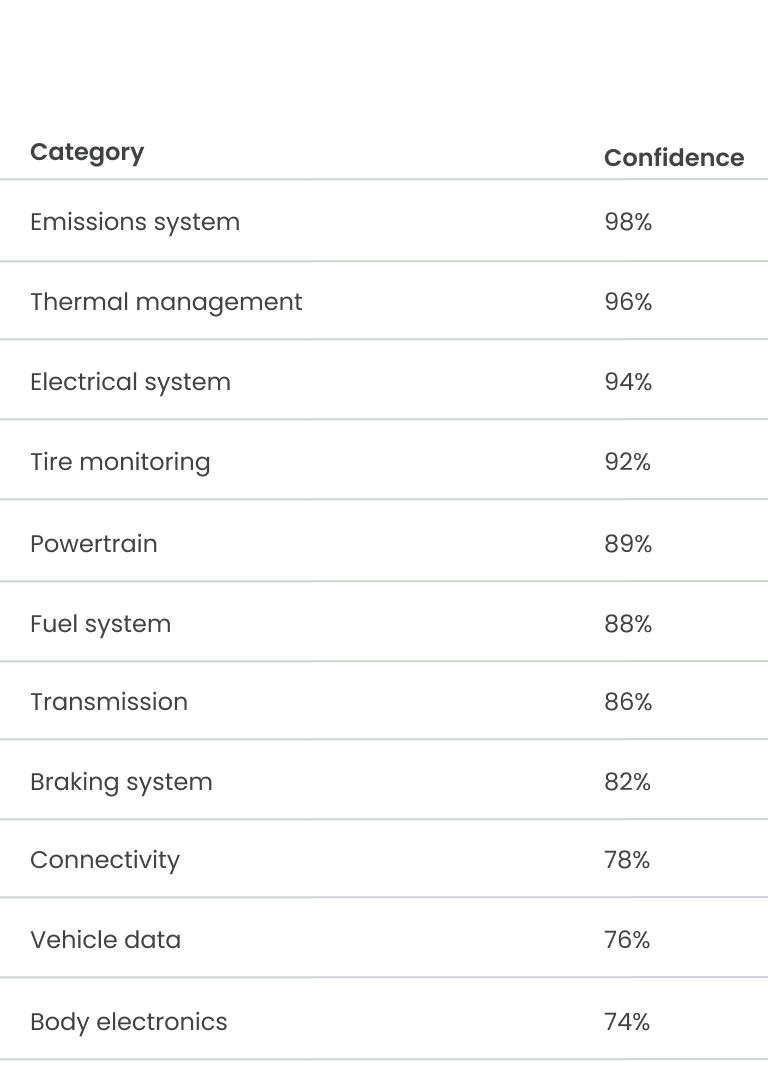
Investigation Timeline, Digital twin view: a searchable table of detected vehicle conditions with name, last occurrence, category and confidence, across emissions, thermal management, electrical, tire monitoring, powertrain, fuel, transmission, braking, connectivity, vehicle data and body electronics
Digital twin table with search: name, last occurrence, category and confidence for eleven detected vehicle conditions
Digital twin table with search, name and last occurrence for eleven detected conditionsThe same eleven rows: category and confidence, from Emissions system 98% to Body electronics 74%

05

THE EXPERIENCE

One investigation, multiple ways to reduce uncertainty.

  1. 01Orient
  2. 02Trace
  3. 03Compare
  4. 04Explain
  5. 05Expand

01ORIENT

Establish the alert and vehicle state.

The selected alert, recurrence information, location, and Signals info establish the investigation context before deeper analysis begins.

02TRACE

Reconstruct the sequence around the alert.

The Timeline shows surrounding activity while highlighting the events that contributed to the alert.

The Map adds spatial context to that same sequence.

03COMPARE

Look for coordinated behavior.

Selected events can be compared over time to expose correlations, simultaneous spikes, and threshold crossings.

04EXPLAIN

Inspect the detection logic.

Logic & performance connects the alert back to the conditions, structure, Hits, and Hit Rate behind the detection.

05EXPAND

Explore the wider vehicle context.

Digital Twin extends the investigation into additional detected conditions, organized by vehicle system, recency, and confidence.

From event history to an investigation framework.

The Investigation Timeline turns a chronological event stream into a persistent context layer for deeper analysis.

Instead of forcing analysts to move between disconnected tools, the experience keeps the alert, vehicle state, and event history stable while allowing them to change the way the incident is examined.

Keep the sequence visible.

Change the analytical lens.

Never lose the investigation thread.