CASE STUDY

Detector Health

Turning detector management into a workflow for identifying noise, prioritizing investigation, and understanding its cause.

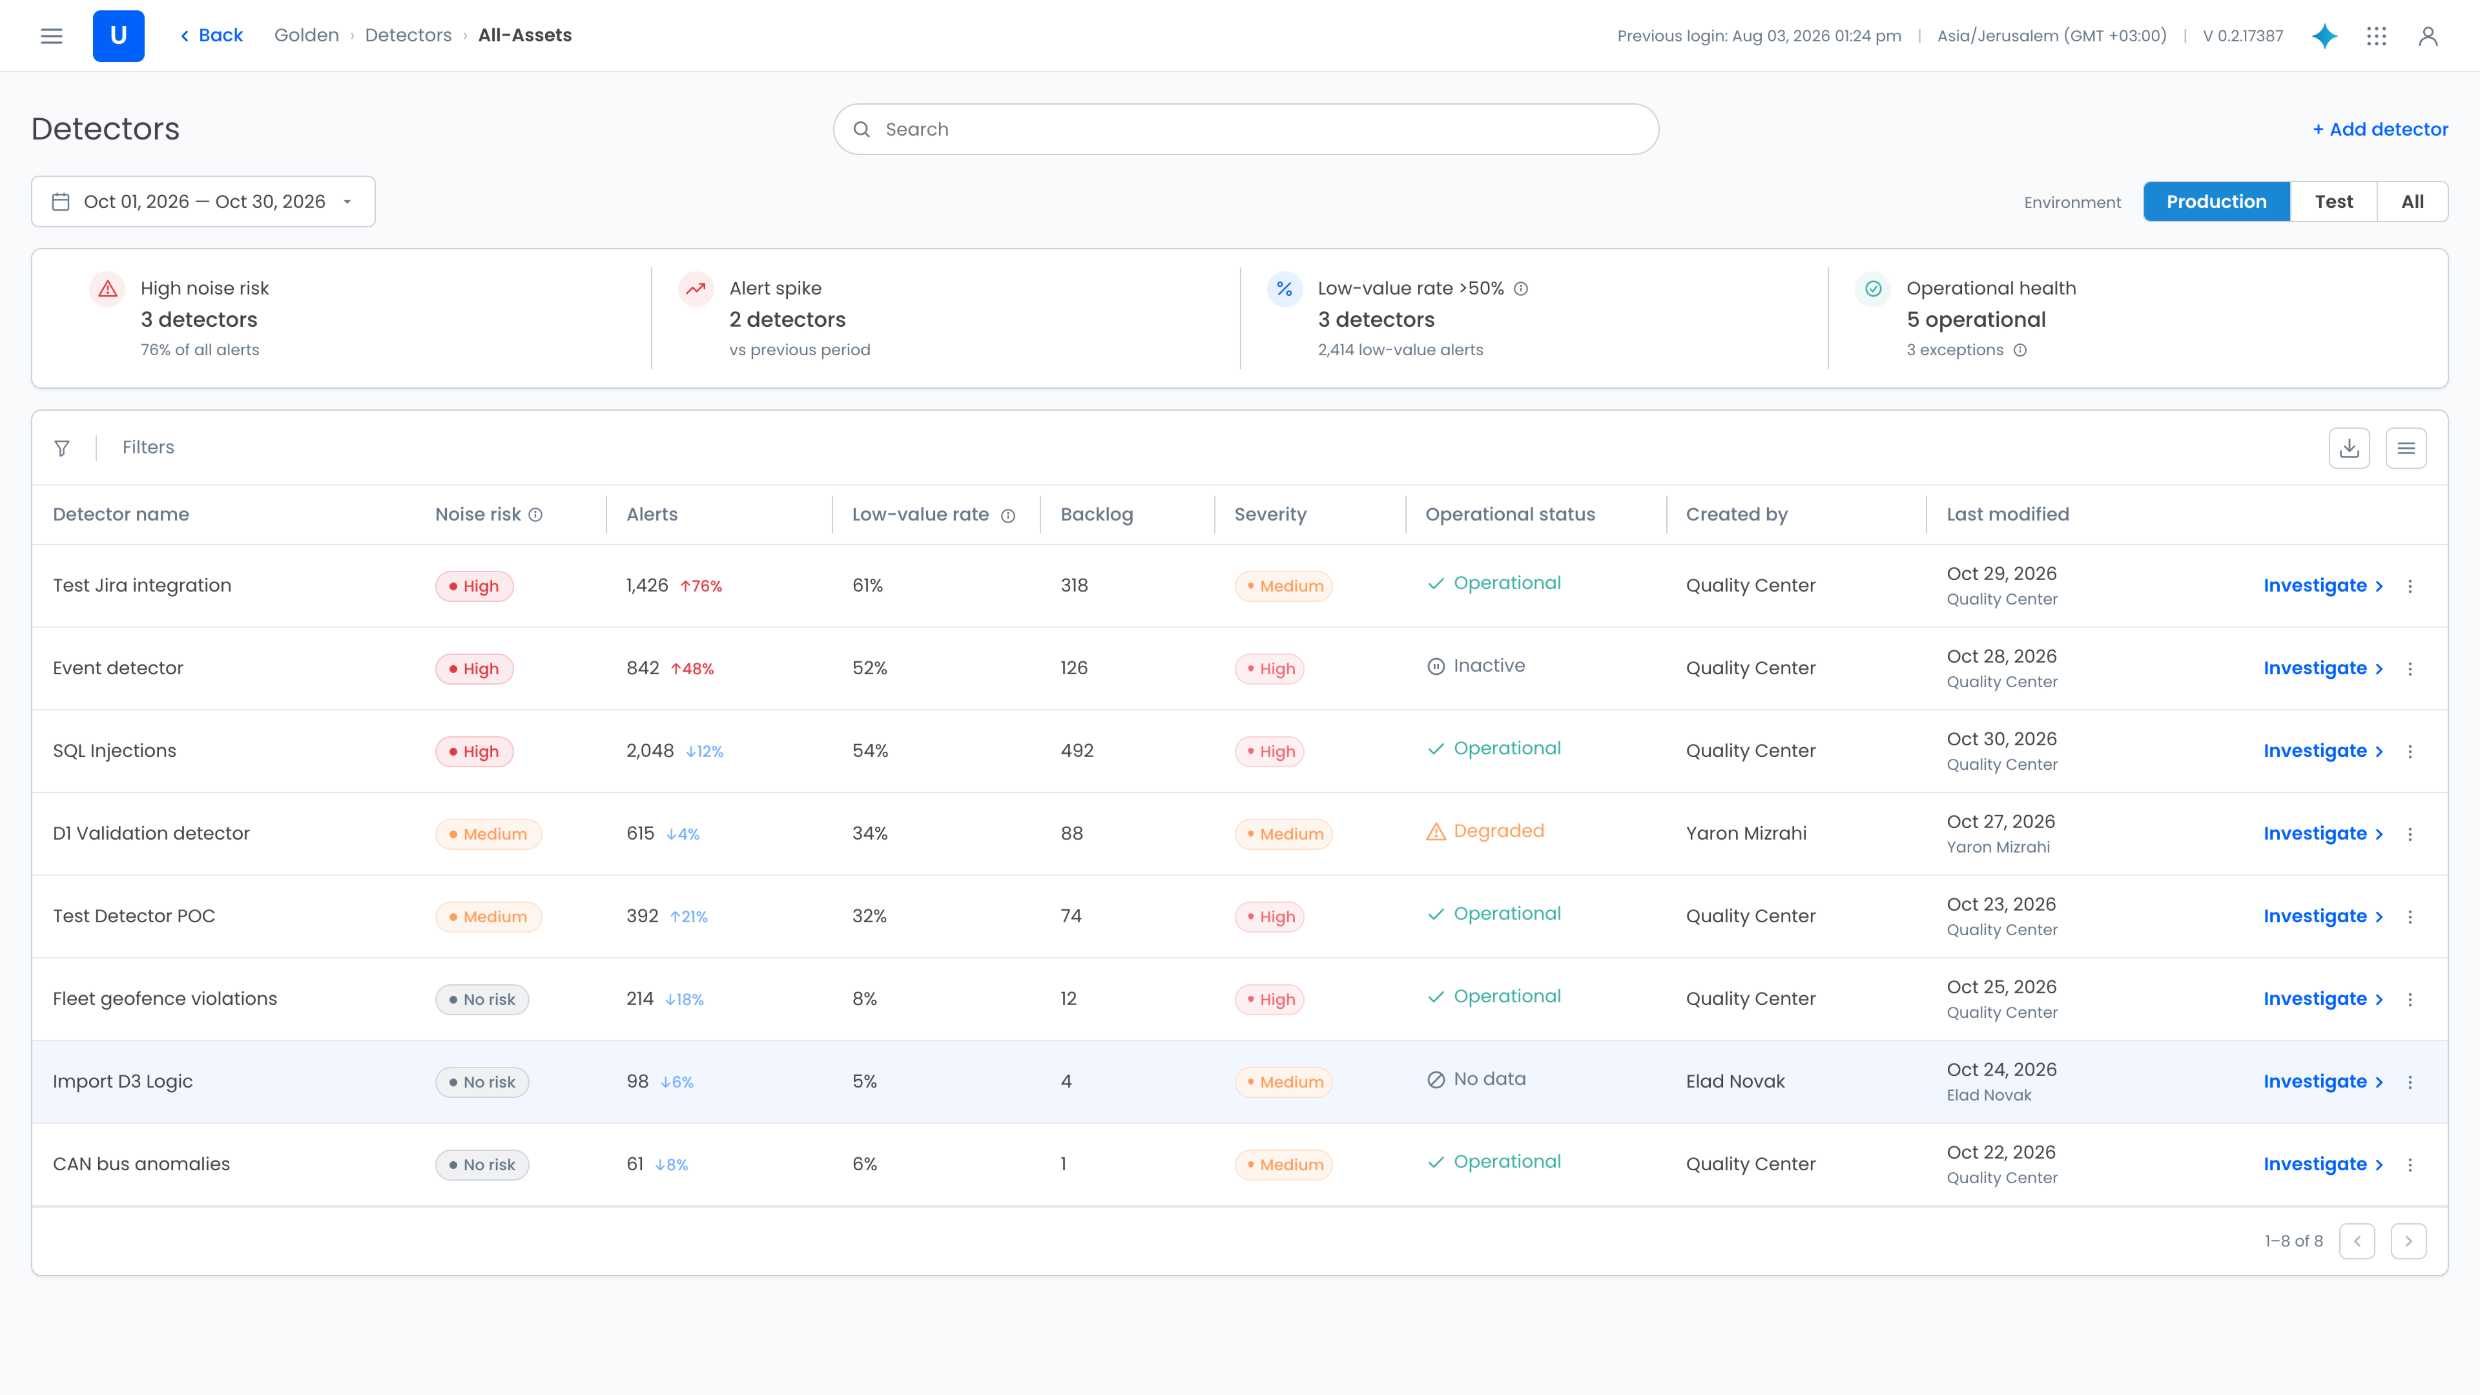
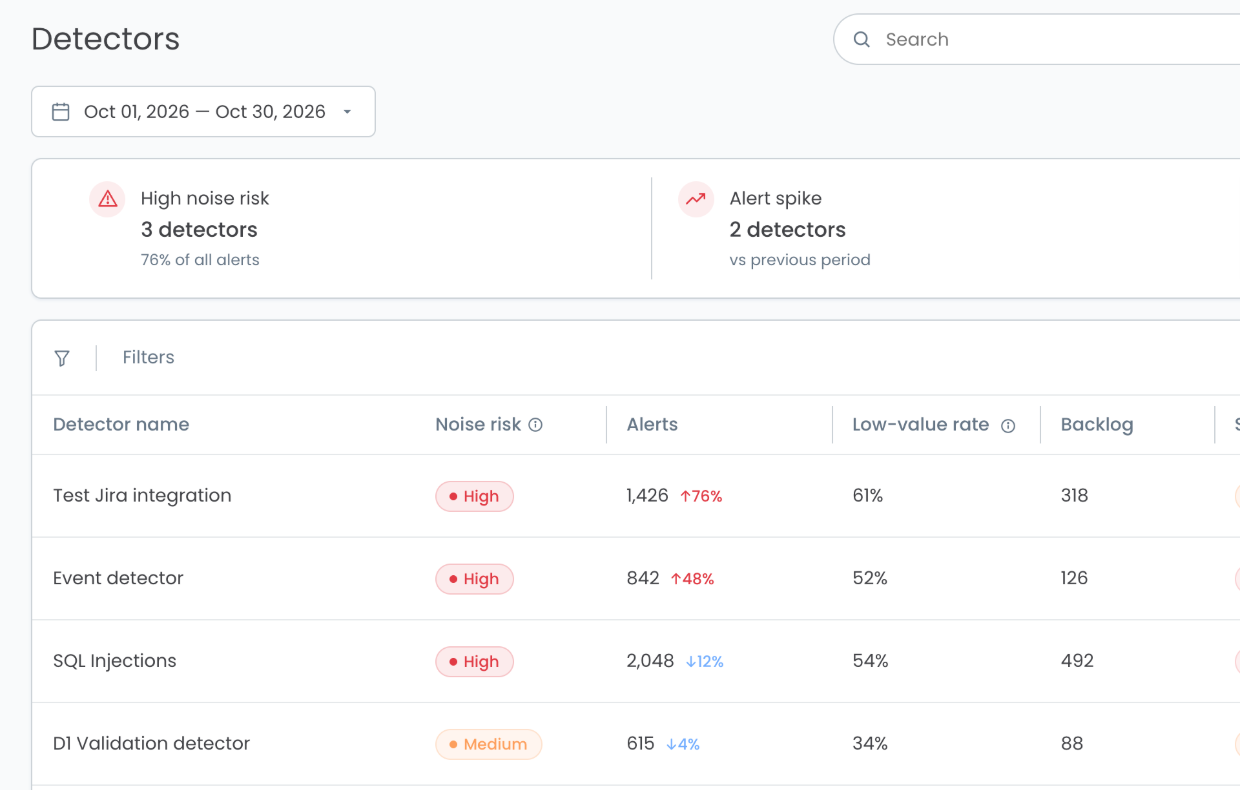
Detector Health: Detectors page with four health KPIs (high noise risk, alert spike, low-value rate above 50%, operational health) above a detector table showing noise risk, alerts with period-over-period change, low-value rate, backlog, severity, operational status and an Investigate action per row Detectors page, mobile crop: High noise risk and Alert spike KPIs above the first detector rows with their Noise risk, alerts, low-value rate and backlog
ROLE
Senior Product Designer
DOMAIN
Automotive Cybersecurity
USERS
VSOC Analysts
FOCUS
Detector Health · Noise Reduction · Investigation
SCOPE
User Research · Product Strategy · UX · UI

01

CONTEXT

Detectors were being managed as records, not understood as a system.

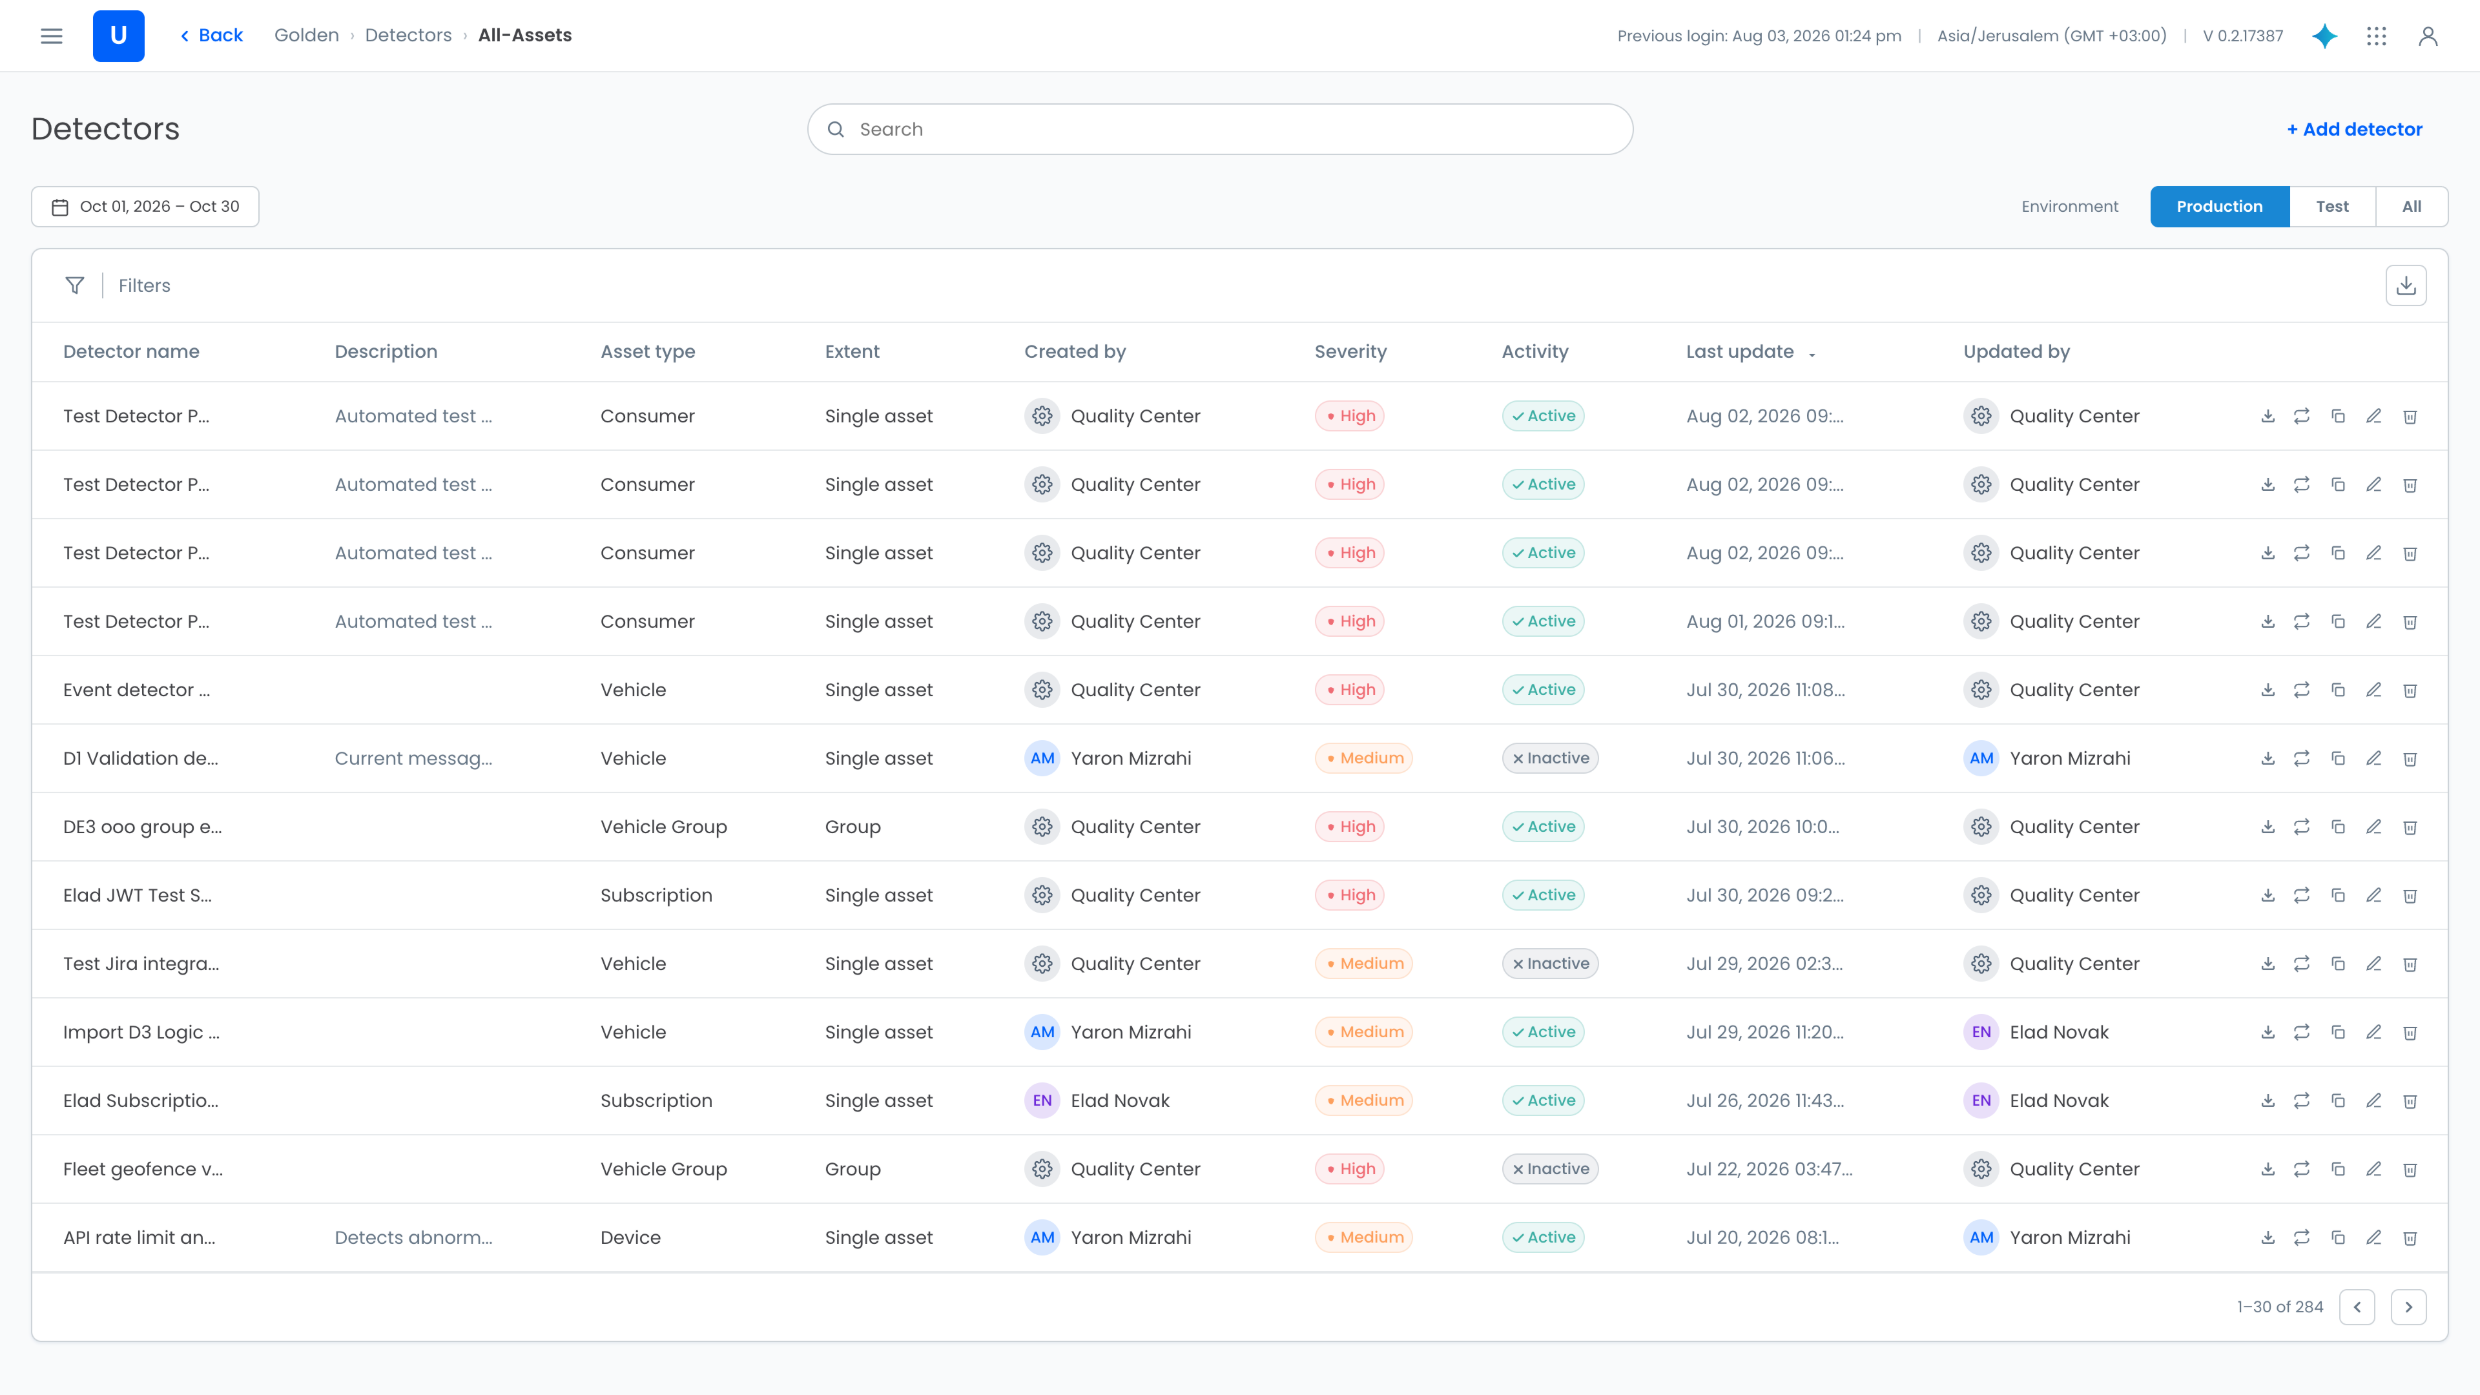
The original Detectors page was primarily an administrative table.

It exposed information such as detector name, description, asset type, extent, severity, activity status, creator, and last update. Analysts could search for a specific detector and perform management actions such as editing, duplicating, re-running, downloading, or deleting it.

What the page did not provide was a system-level view of detector quality.

There were no KPIs, no health overview, and no way to quickly understand which detectors were producing excessive noise or unnecessary alerts.

An analyst could manage an individual detector, but could not answer a more important operational question:

Which detectors need my attention right now?

The original Detectors page before the redesign: an administrative table listing detector name, description, asset type, extent, creator, severity, activity status, last update and updated by, with download, re-run, duplicate, edit and delete actions on each row

02

THE CHALLENGE

An active detector can still be a bad detector.

The existing experience exposed whether a detector was active or inactive, but operational status alone says very little about detection quality.

A detector can be running normally while generating a large volume of low-value alerts, creating an investigation backlog, or showing a sudden increase in alert activity.

For the VSOC, the challenge was therefore not simply knowing whether detectors existed or were enabled.

They needed to understand:

Which detectors are generating unnecessary work, why are they doing it, and where should investigation begin?

The redesign had to introduce this operational layer without removing the detector-management capabilities analysts already relied on.

03

RESEARCH

The main problem was not managing detectors. It was identifying the ones creating unnecessary work.

I interviewed four VSOC analysts to understand how they assess detector quality, identify excessive noise, and decide which detectors require investigation.

What I needed to understand

  1. 01

    How do analysts recognize that a detector is becoming noisy?

  2. 02

    Which signals help them decide which detector deserves attention first?

  3. 03

    Once a problematic detector is identified, what information is needed to understand the cause?

What I learned

  1. 01

    Analysts needed a system-level view before examining individual detectors

    The existing flat table forced analysts to work detector by detector.

    The VSOC needed to understand the overall state of the detector population first, then narrow the investigation.

  2. 02

    Detector availability and detector quality are different concepts

    Active or Operational indicates that a detector is running.

    It does not indicate whether the detector is producing useful alerts.

    A detector could therefore be fully operational while still creating significant operational noise.

  3. 03

    Prioritization had to happen before investigation

    Analysts needed signals that could help them isolate suspicious detectors before opening each one individually.

    Alert spikes, low-value rates, alert volume, and backlog became central to that prioritization.

  4. 04

    Identifying noise was not enough

    Once a detector was flagged, analysts needed to understand how much noise it generated, what kind of low-value alerts it produced, how its behavior changed over time, which assets were affected, what tuning had previously been performed, and whether those changes improved the detector.

  5. 05

    The logic itself needed to be explainable

    Performance metrics could reveal that a detector was problematic, but analysts also needed to understand which conditions inside its logic were contributing to matches and failures.

  6. 06

    Existing management workflows still mattered

    The redesign could not turn the page into analytics only.

    Editing, re-running, duplicating, downloading, and deleting detectors still needed to remain available.

RESEARCH DIRECTION

Detector inventory → individual management

BECOMES

System health → prioritization → detector investigation → logic-level diagnosis

04

KEY PRODUCT DECISIONS

The research shifted the experience from detector administration toward continuous detection-quality management.

DECISION 01

Start with detector health, not the detector list

PROBLEM

The original page immediately exposed the table, giving analysts no indication of the overall condition of the detector population.

DECISION

Add a system-level overview above the table using the signals most relevant to VSOC operations:

High noise risk · Alert spike · Low-value rate >50% · Operational health

RATIONALE

The first question should no longer be: “Which detector do I want to open?”

It should be: “Where is the problem?”

The overview provides a fast health snapshot before the analyst starts filtering or investigating individual detectors.
DECISION 02

Turn noise into a prioritization signal

PROBLEM

No single underlying metric was sufficient to describe whether a detector was producing problematic noise.

High alert volume may reflect legitimate activity, while a high percentage of low-value alerts can indicate poor detector quality even when no alert spike exists.

DECISION

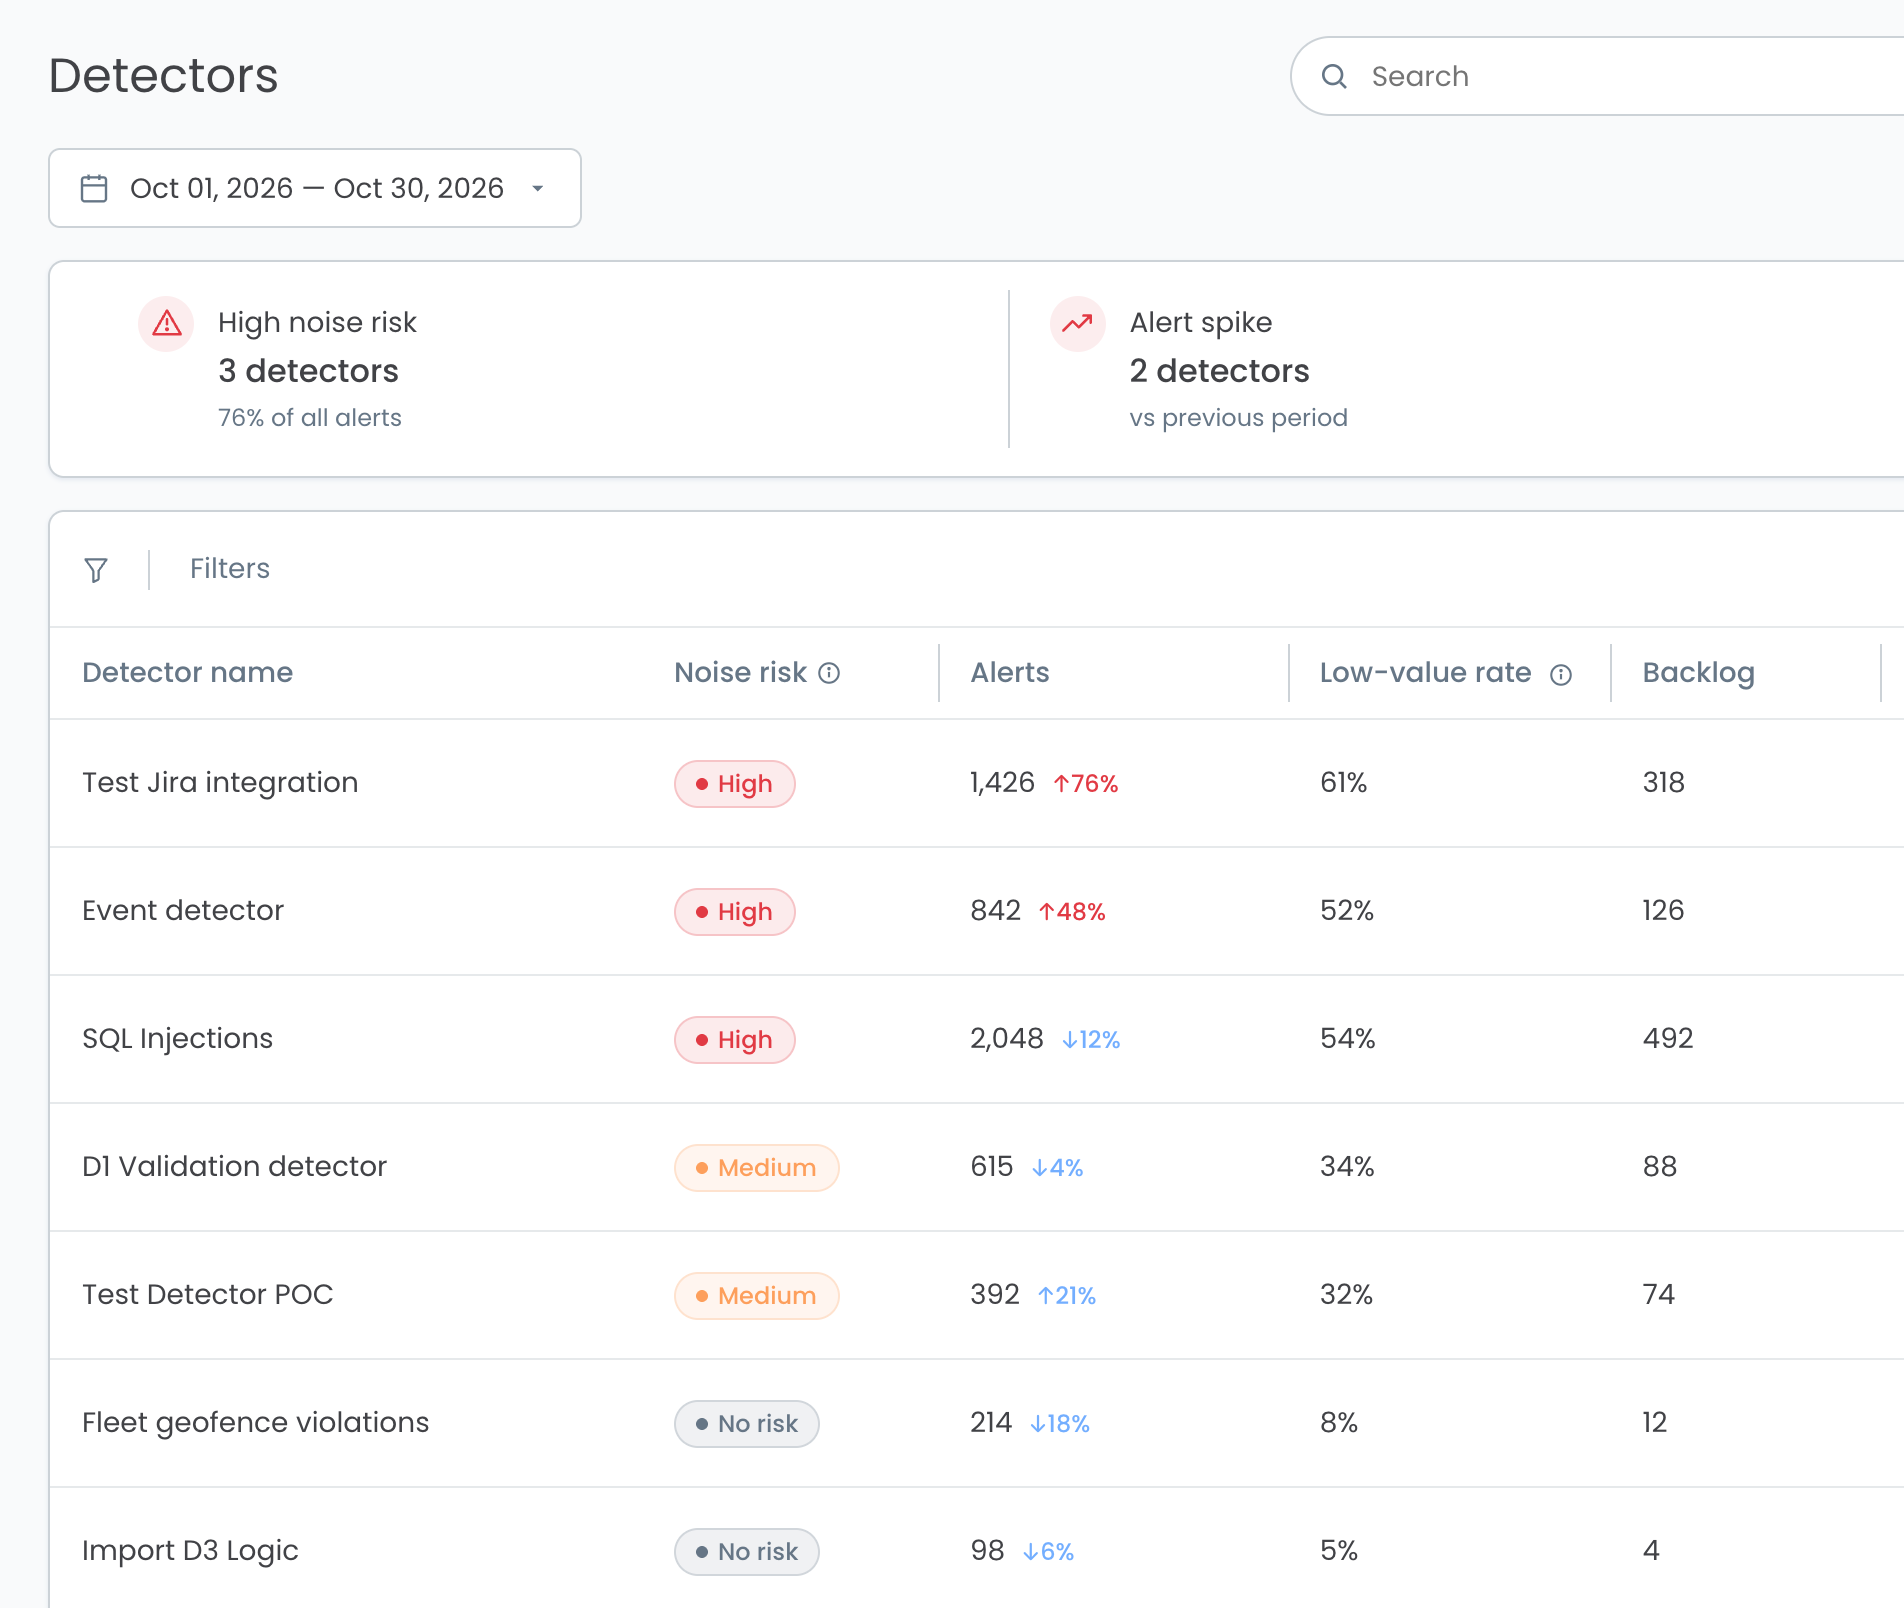
Introduce Noise Risk as a derived signal based on the combination of:

Alert Spike + Low-value Rate

The table surfaces the result as High · Medium · No risk, while keeping the underlying metrics available for inspection.

RATIONALE

Instead of asking analysts to interpret several metrics independently for every detector, Noise Risk provides a faster prioritization layer.

It tells the analyst where to look first without hiding the evidence behind the classification.

Focused crop of the Detectors page: High noise risk (3 detectors, 76% of all alerts) and Alert spike (2 detectors) KPIs above the table, where each detector shows its Noise risk as High, Medium or No risk next to alerts with period-over-period change, low-value rate and backlog

DECISION 03

Turn the detector table from inventory into triage

PROBLEM

The original table emphasized administrative metadata rather than detector performance.

DECISION

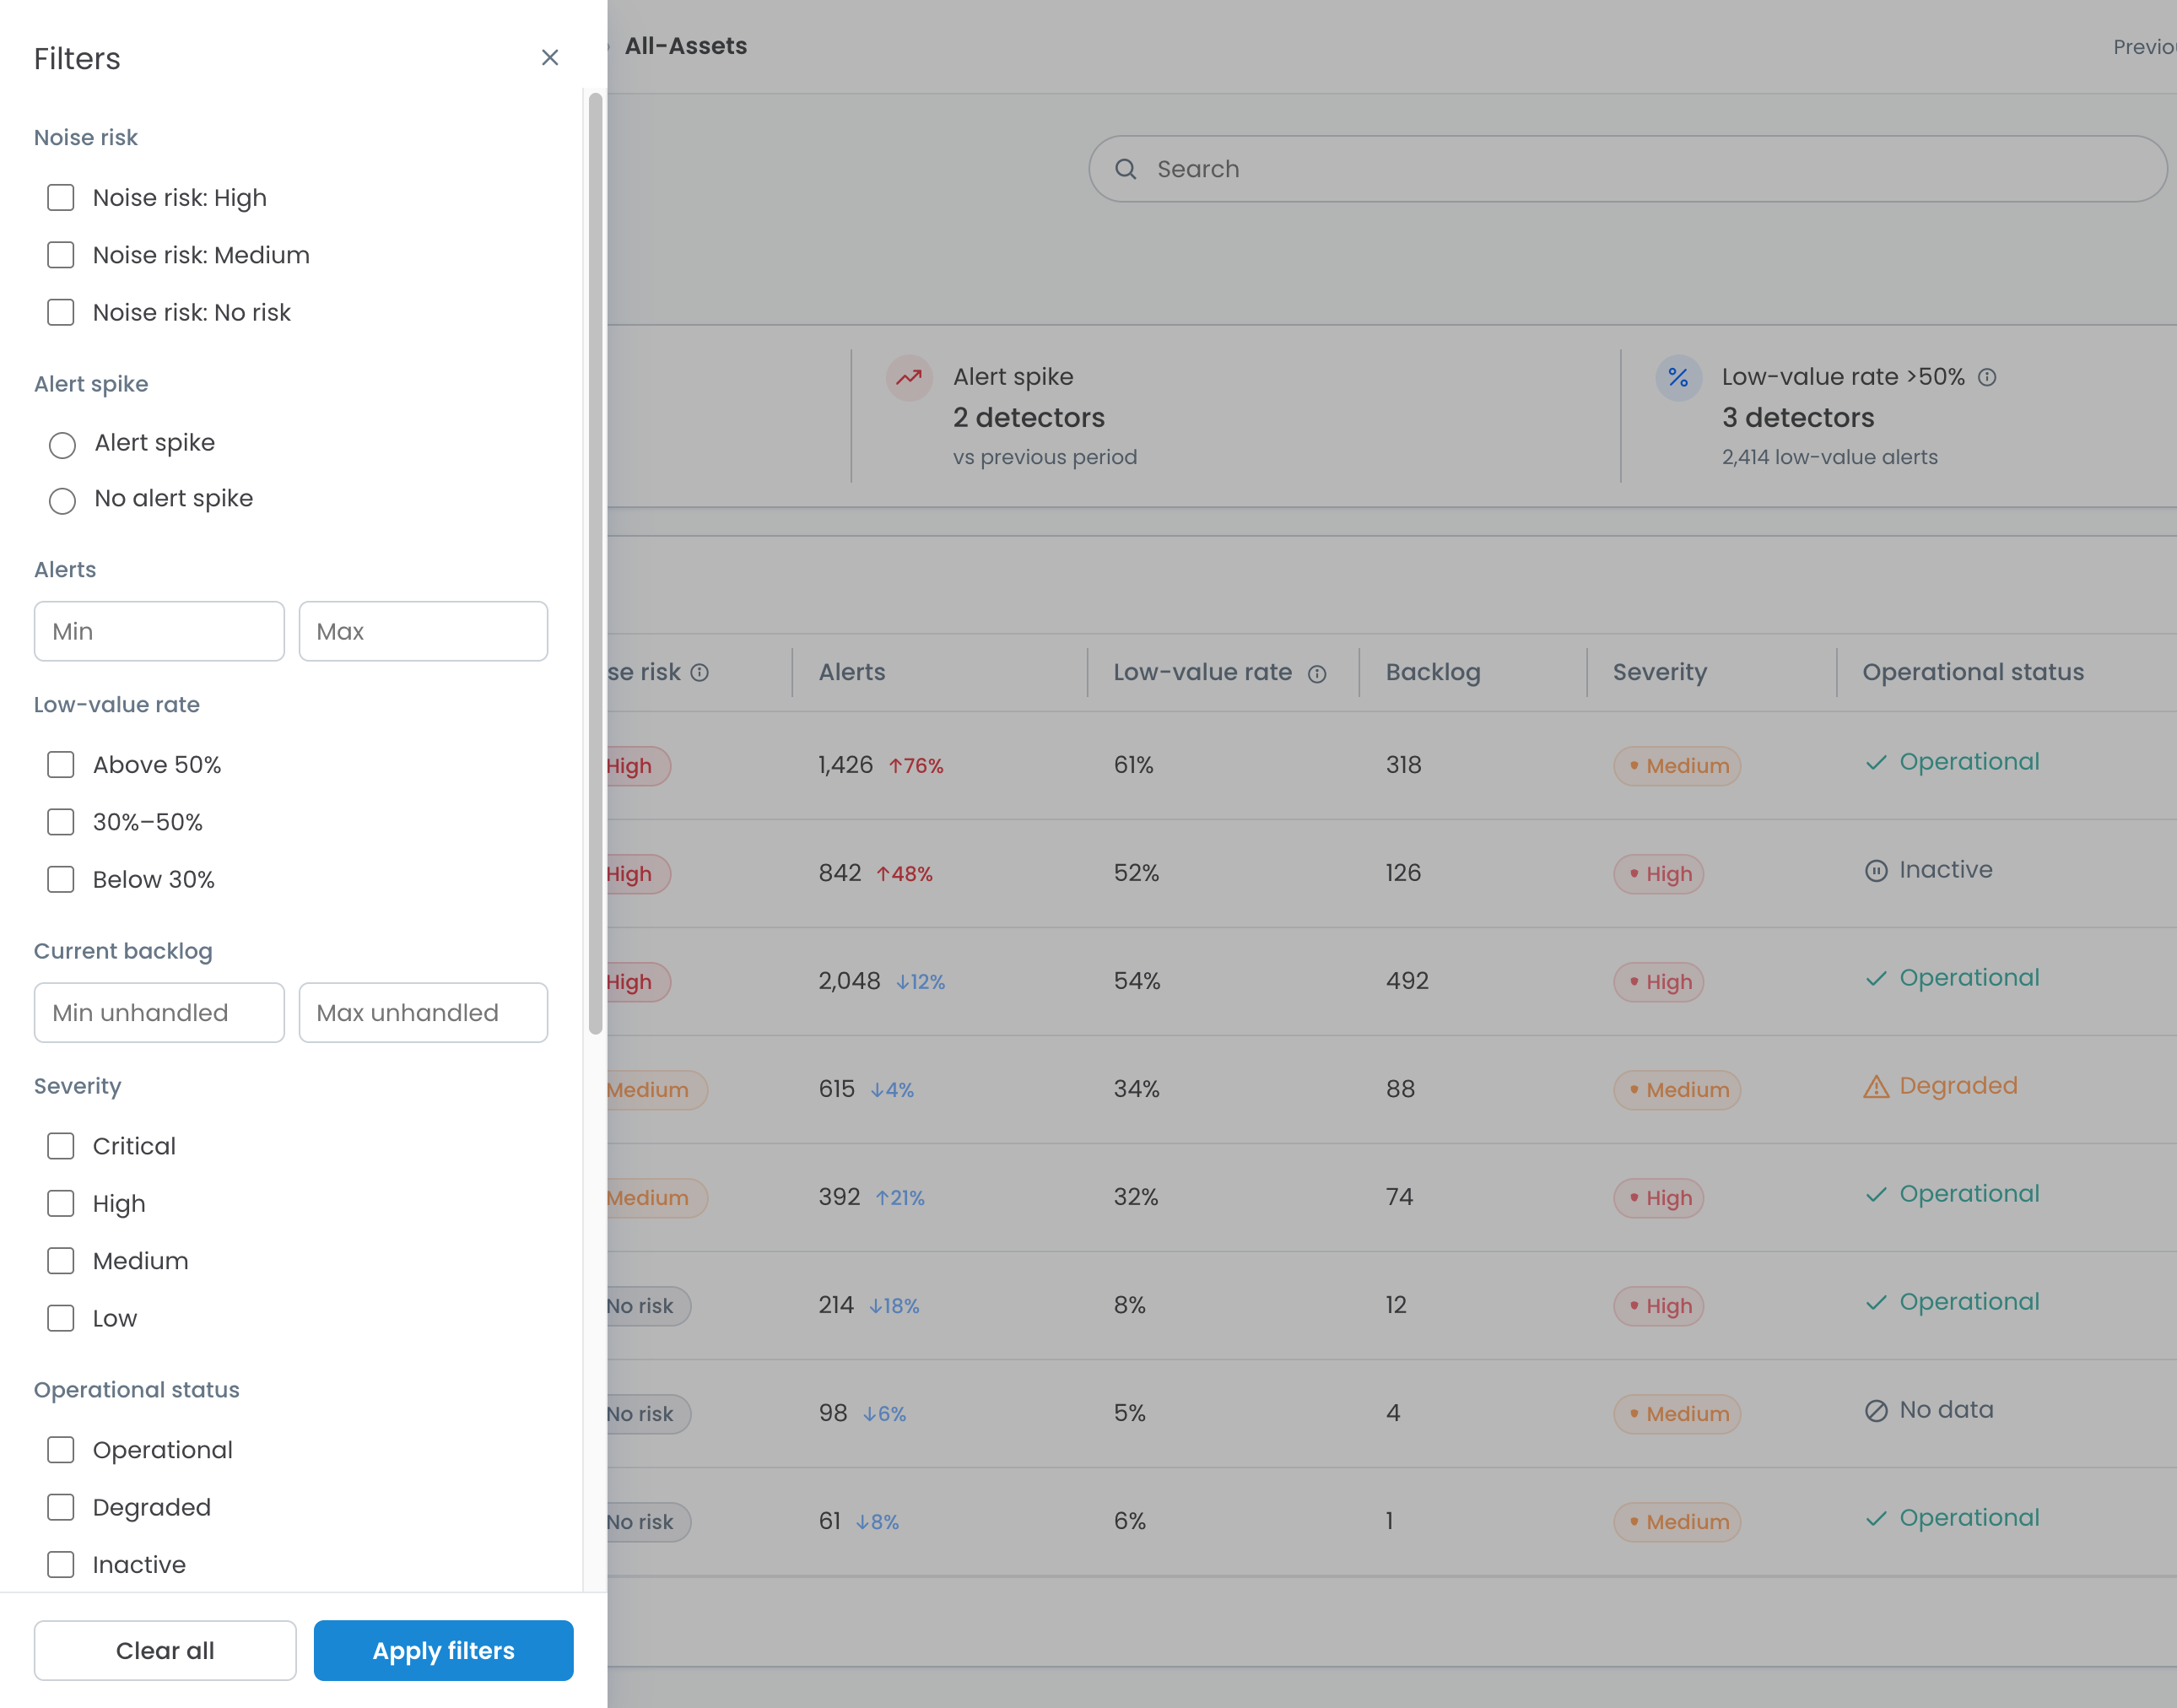
Rebuild the table around operational signals: Noise Risk, Alerts and period-over-period change, Low-value rate, Backlog, Severity, and Operational status.

The filter panel supports the same investigation dimensions, including Noise Risk, Alert Spike, alert volume, Low-value rate, backlog, severity, operational status, asset type, extent, and last modified date.

A clear Investigate action provides the path from system-level triage into the individual detector.

RATIONALE

The table should help analysts move from a broad system-level problem to a manageable set of detectors that require investigation.

Existing administrative actions remain available through the row menu, preserving the workflows from the original experience.

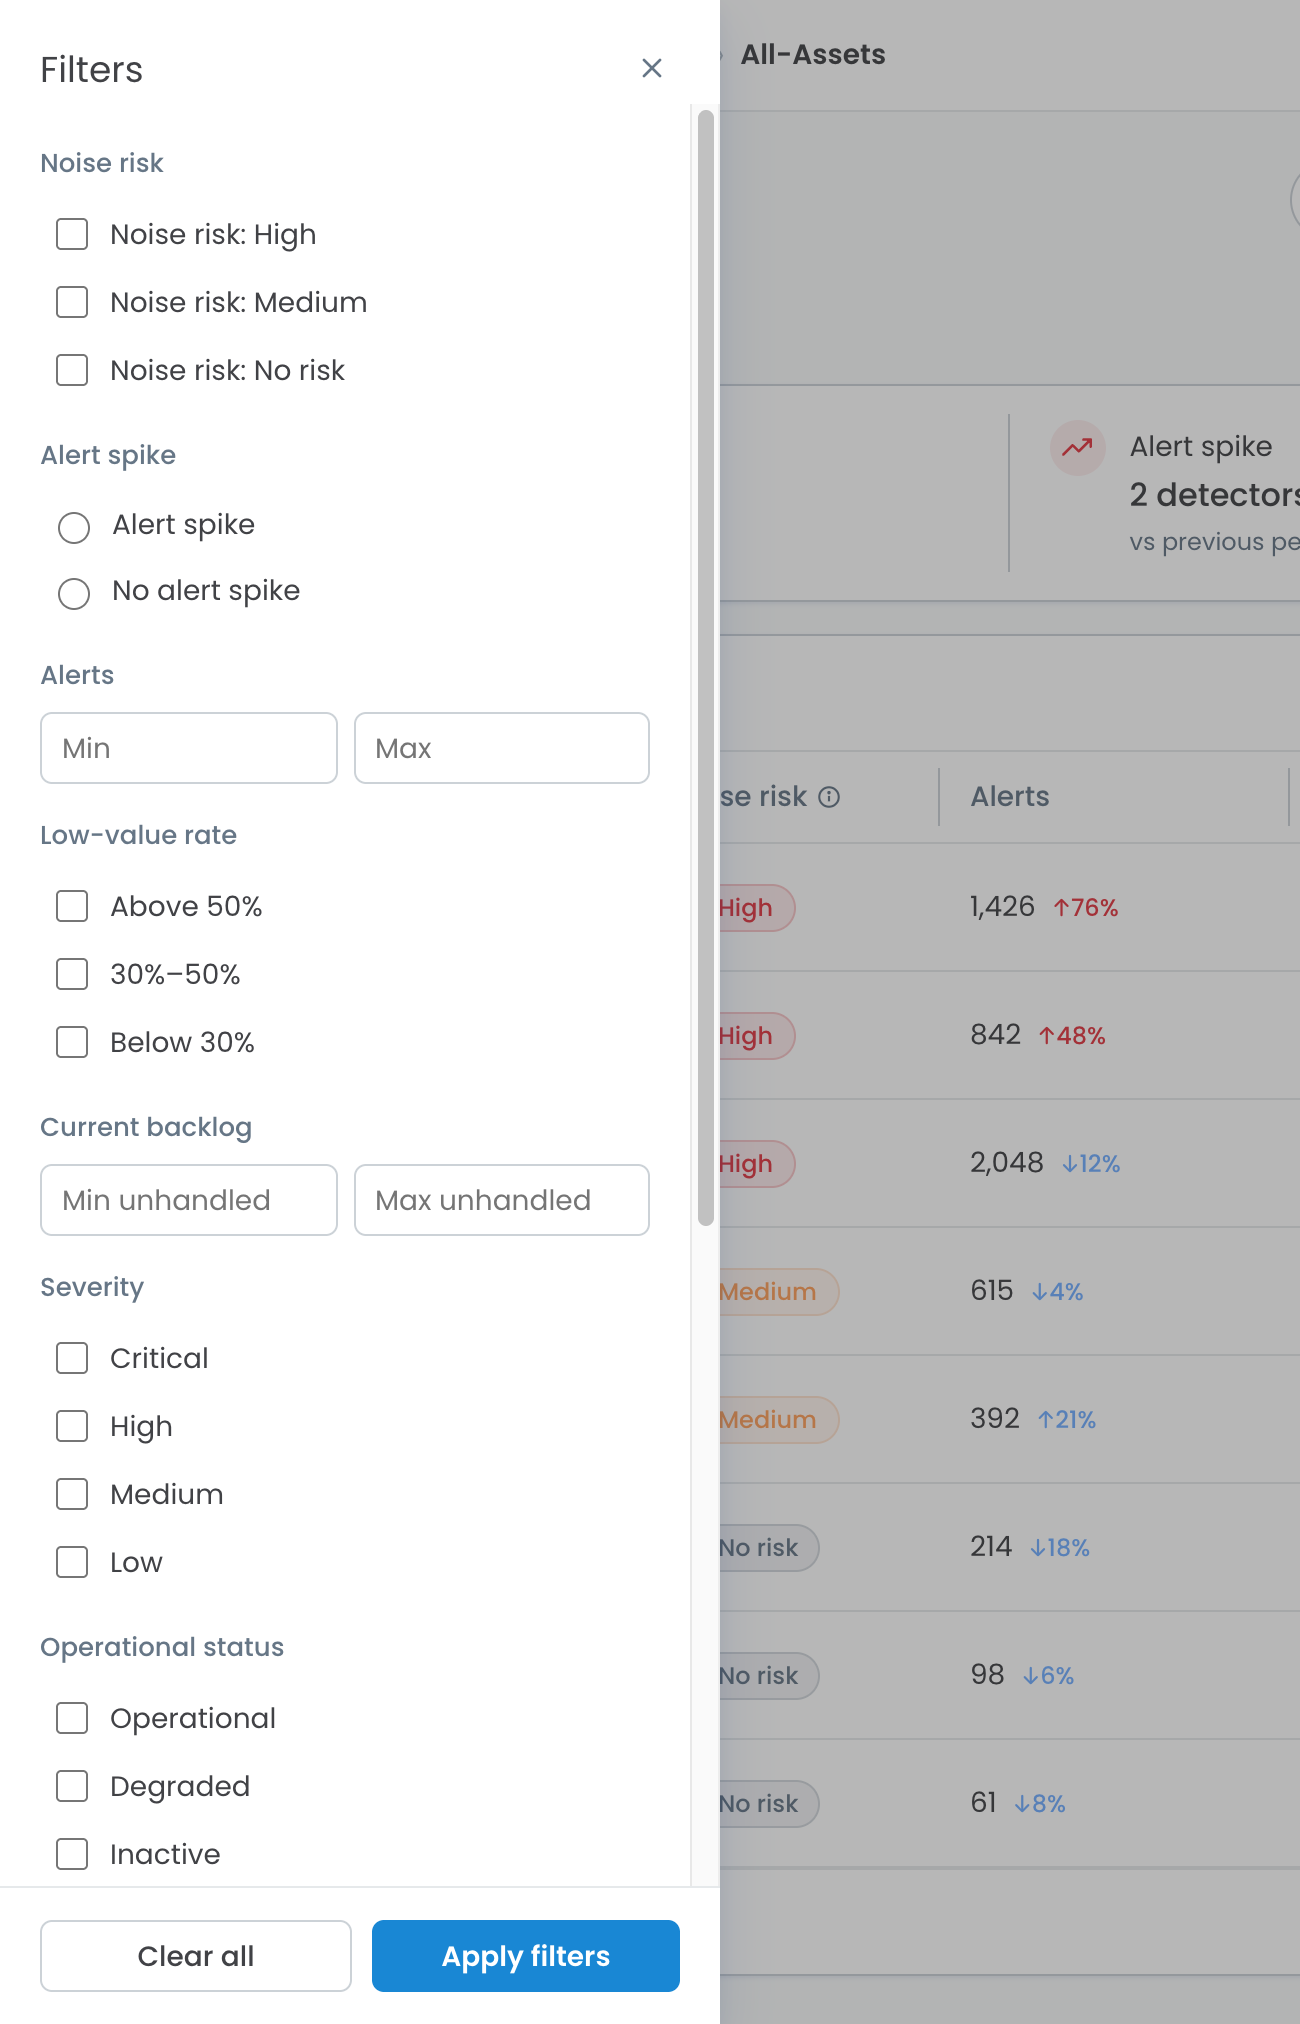
Detector table with the Filters panel open: filters for Noise risk (High, Medium, No risk), Alert spike, alert volume, Low-value rate (above 50%, 30–50%, below 30%), current backlog, Severity and Operational status, with Clear all and Apply filters actions Filters panel, mobile crop: Noise risk, Alert spike, Alerts, Low-value rate, Current backlog, Severity and Operational status filters beside the detector rows they narrow

DECISION 04

Explain why a detector is noisy, not only that it is noisy

PROBLEM

A high Noise Risk signal identifies a detector worth investigating, but it does not explain what is causing the problem.

DECISION

Create a dedicated Detector Overview combining operational health, noise indicators, alert quality, trends, backlog, and change history.

This gives analysts the evidence needed to understand why a detector is producing noise.

RATIONALE

The investigation should progress from prioritization to an evidence-based explanation of detector behavior.

The analyst can distinguish between whether a detector is operating correctly and whether the alerts it produces are actually useful.

DECISION 05

Make the detector logic itself investigable

PROBLEM

Performance metrics can reveal that a detector behaves poorly without revealing which part of the detector logic is responsible.

DECISION

Introduce Logic Analysis with two complementary views:

Matched explains which conditions contributed to occurrences that generated alerts.

Mismatched explains which conditions failed and how frequently they prevented occurrences from matching.

AI analysis adds a Key finding, Interpretation, and Recommendation based on the observed logic behavior.

RATIONALE

The analyst should be able to move from:

“This detector is noisy.”

to:

“This condition or branch is driving the behavior.”

05

THE EXPERIENCE

From system-wide noise detection to logic-level diagnosis.

  1. 01Scan
  2. 02Prioritize
  3. 03Diagnose
  4. 04Explain
  5. 05Evaluate

01SCAN

Start with the health of the detector population.

The Detectors overview gives the VSOC an immediate picture of the system before individual detectors are examined.

Analysts can quickly see how many detectors have high Noise Risk, whether alert spikes are occurring, how widespread high Low-value rates are, and how many detectors are operational.

This changes the entry point from detector management to detector health monitoring.

Detector Health KPIs at the top of the Detectors page: High noise risk, 3 detectors (76% of all alerts); Alert spike, 2 detectors vs previous period; Low-value rate above 50%, 3 detectors (2,414 low-value alerts); Operational health, 5 operational with 3 exceptions

02PRIORITIZE

Reduce the detector population to the ones that deserve attention.

The table brings the operational signals directly into every row.

Analysts can compare Noise Risk, alert volume and trend, Low-value rate, backlog, severity, and operational status, then use filtering to progressively narrow the list.

For example, the analyst can isolate detectors with:

  • High Noise Risk
  • Low-value rate above 50%
  • Meaningful backlog

and move directly into Investigate.

The original management actions remain available but no longer dominate the workflow.

03DIAGNOSE

Understand what is producing the noise.

Opening a detector separates two questions that were previously easy to confuse:

Is the detector operating correctly?

Is the detector producing useful results?

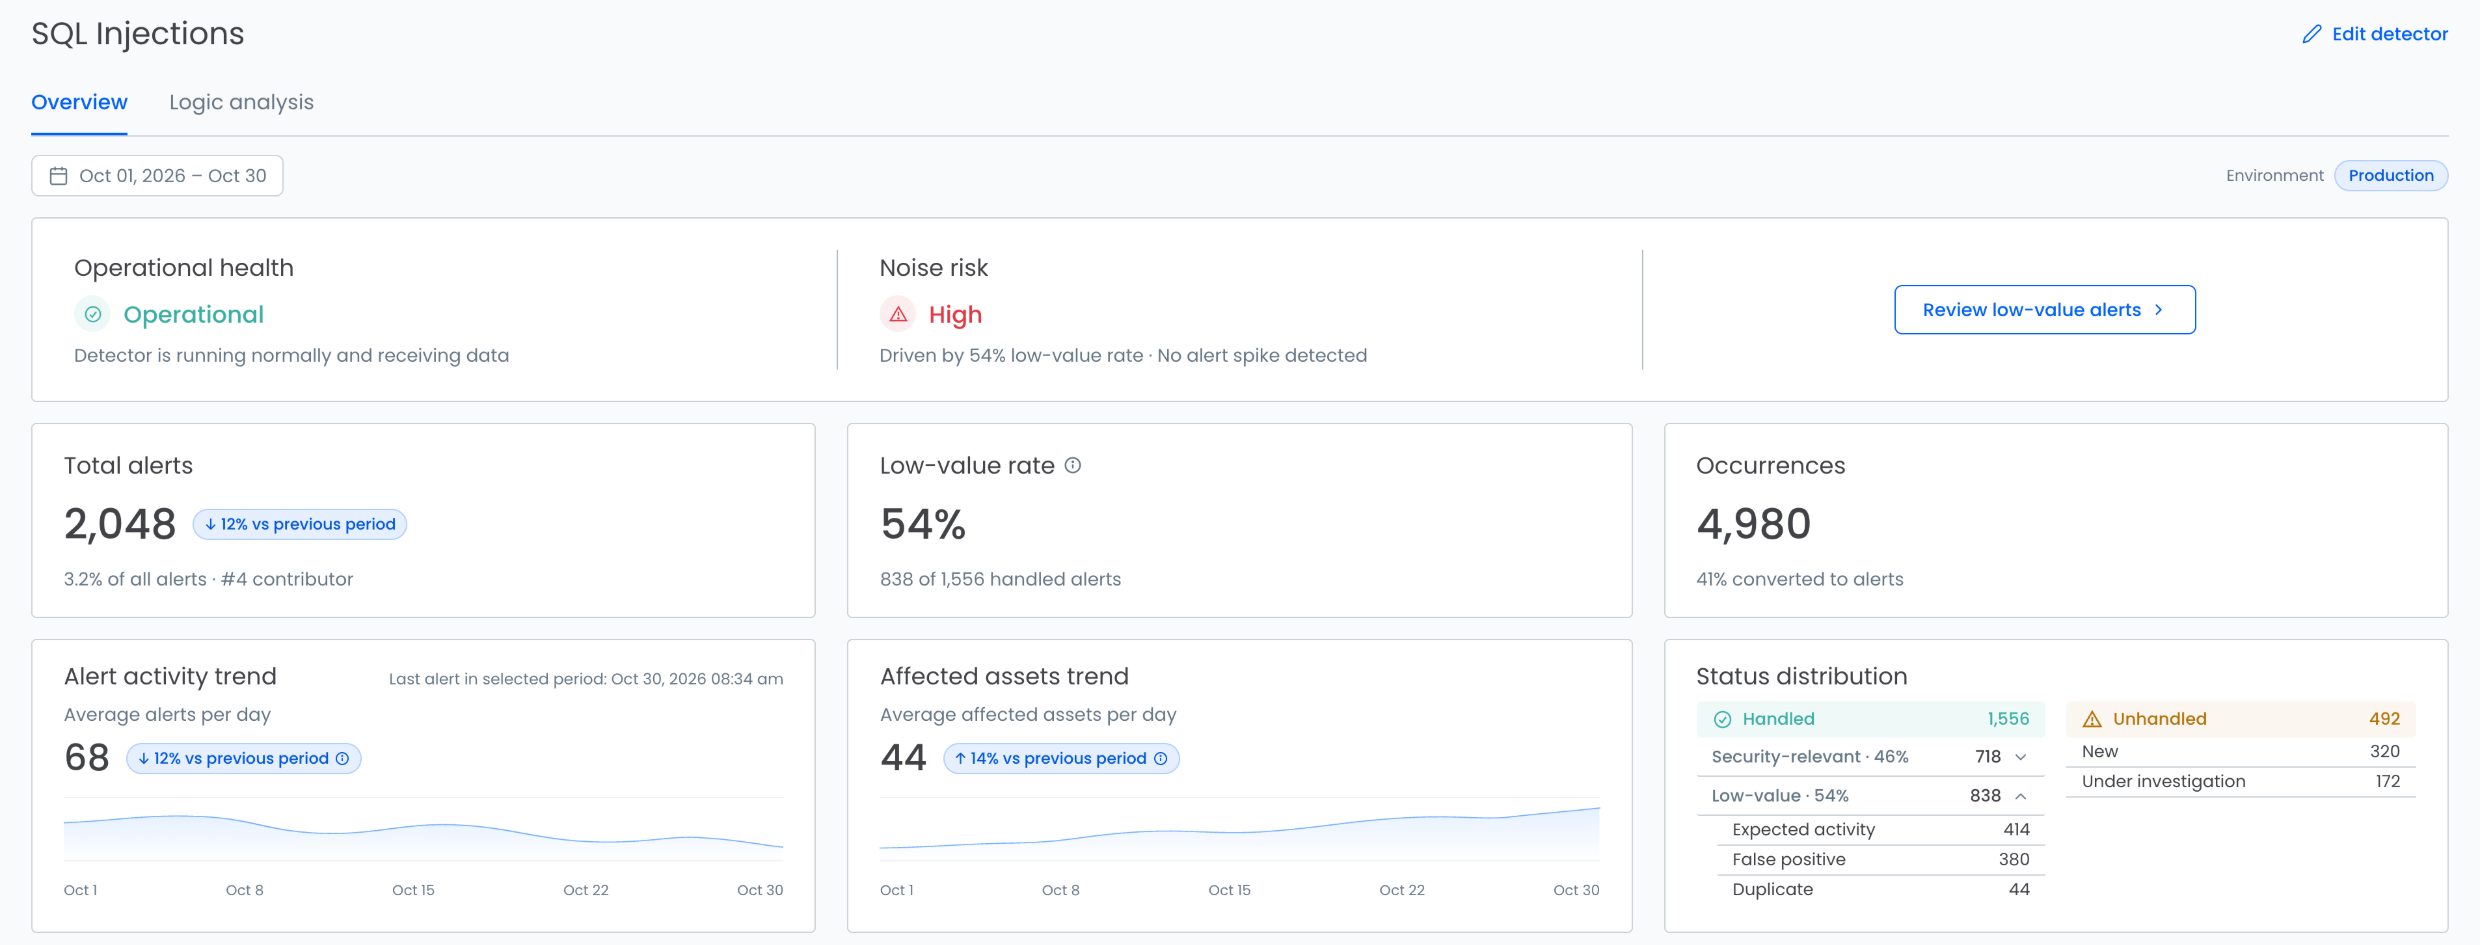
In the SQL Injections example, the detector is Operational while its Noise Risk is High. The reason is immediately visible:

54% Low-value rate · No alert spike detected

This means the problem is not detector availability or a sudden increase in activity. It is the quality of the alerts being generated.

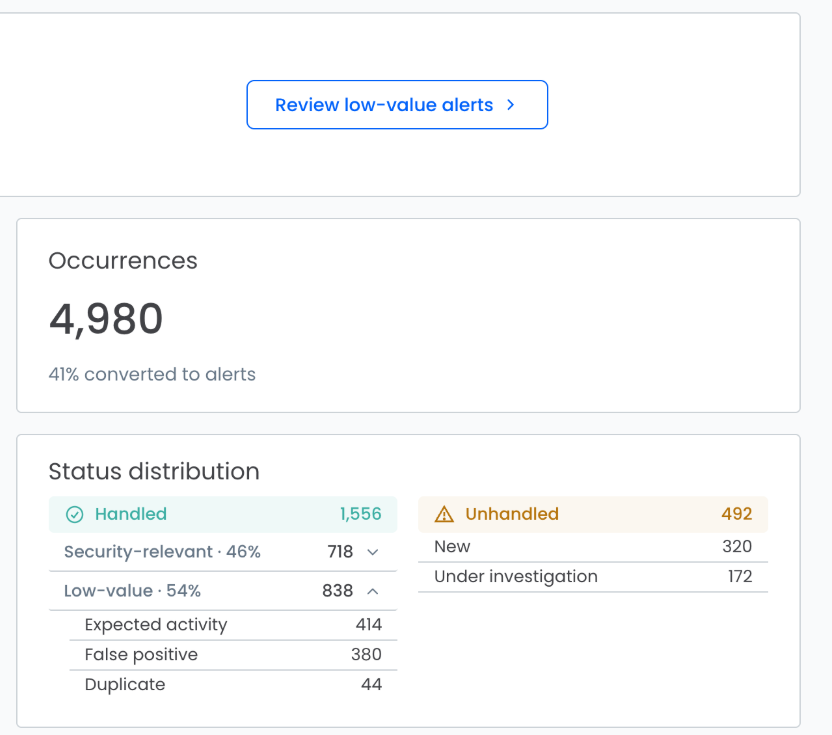
2,048
total alerts
4,980
occurrences
41%
converted to alerts
1,556
handled alerts
838
low-value alerts
492
unhandled alerts

The Low-value alerts are then classified into:

  • Expected activity
  • False positive
  • Duplicate

The trends add temporal context through alert activity and affected assets, while the status distribution exposes the active investigation backlog.

SQL Injections detector overview: Operational health Operational and Noise risk High, driven by a 54% low-value rate with no alert spike; 2,048 total alerts, 54% low-value rate, 4,980 occurrences with 41% converted to alerts; alert activity and affected assets trends; and status distribution with 1,556 handled (838 low-value: 414 expected activity, 380 false positive, 44 duplicate) and 492 unhandled
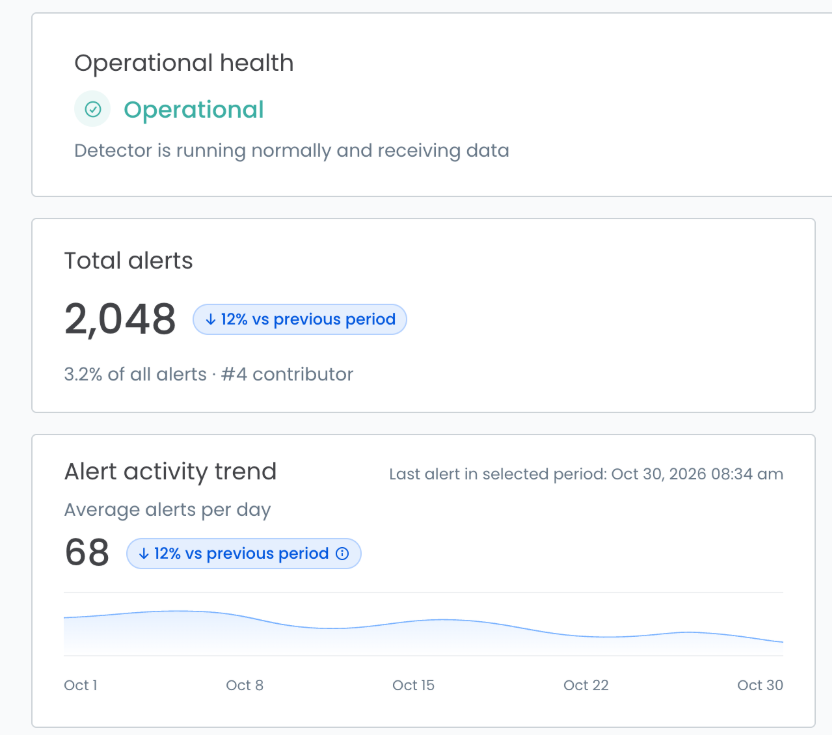
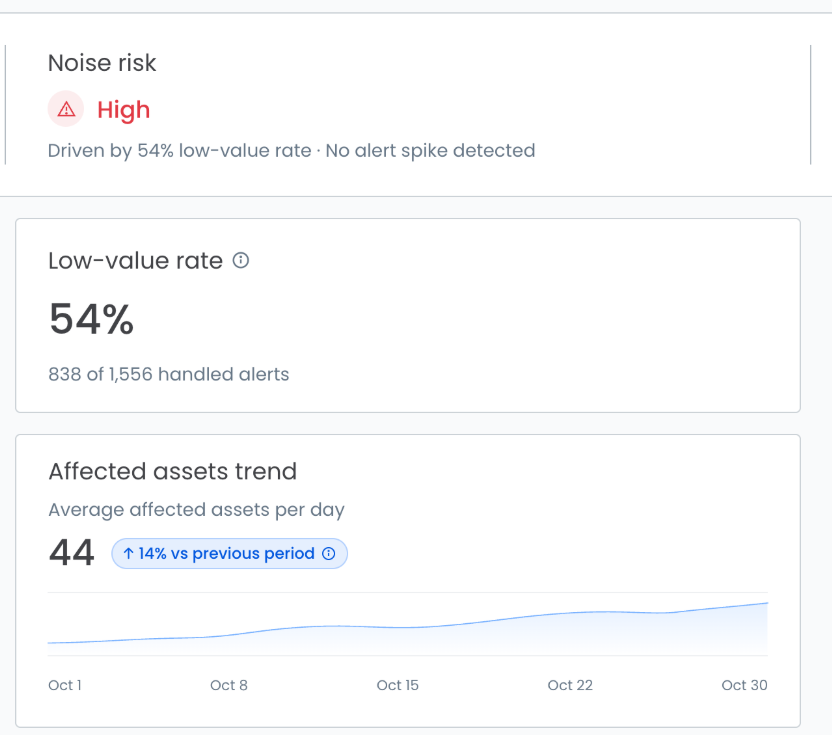
Detector overview, left column: Operational health Operational, 2,048 total alerts (down 12% vs previous period), and the alert activity trend at 68 alerts per day Detector overview, middle column: Noise risk High, driven by a 54% low-value rate with no alert spike; a 54% low-value rate (838 of 1,556 handled alerts); and the affected assets trend at 44 assets per day Detector overview, right column: Review low-value alerts action, 4,980 occurrences with 41% converted to alerts, and status distribution with 1,556 handled (838 low-value: 414 expected activity, 380 false positive, 44 duplicate) and 492 unhandled

04EXPLAIN

Move from detector behavior to detector logic.

The Logic Analysis provides the next level of diagnosis.

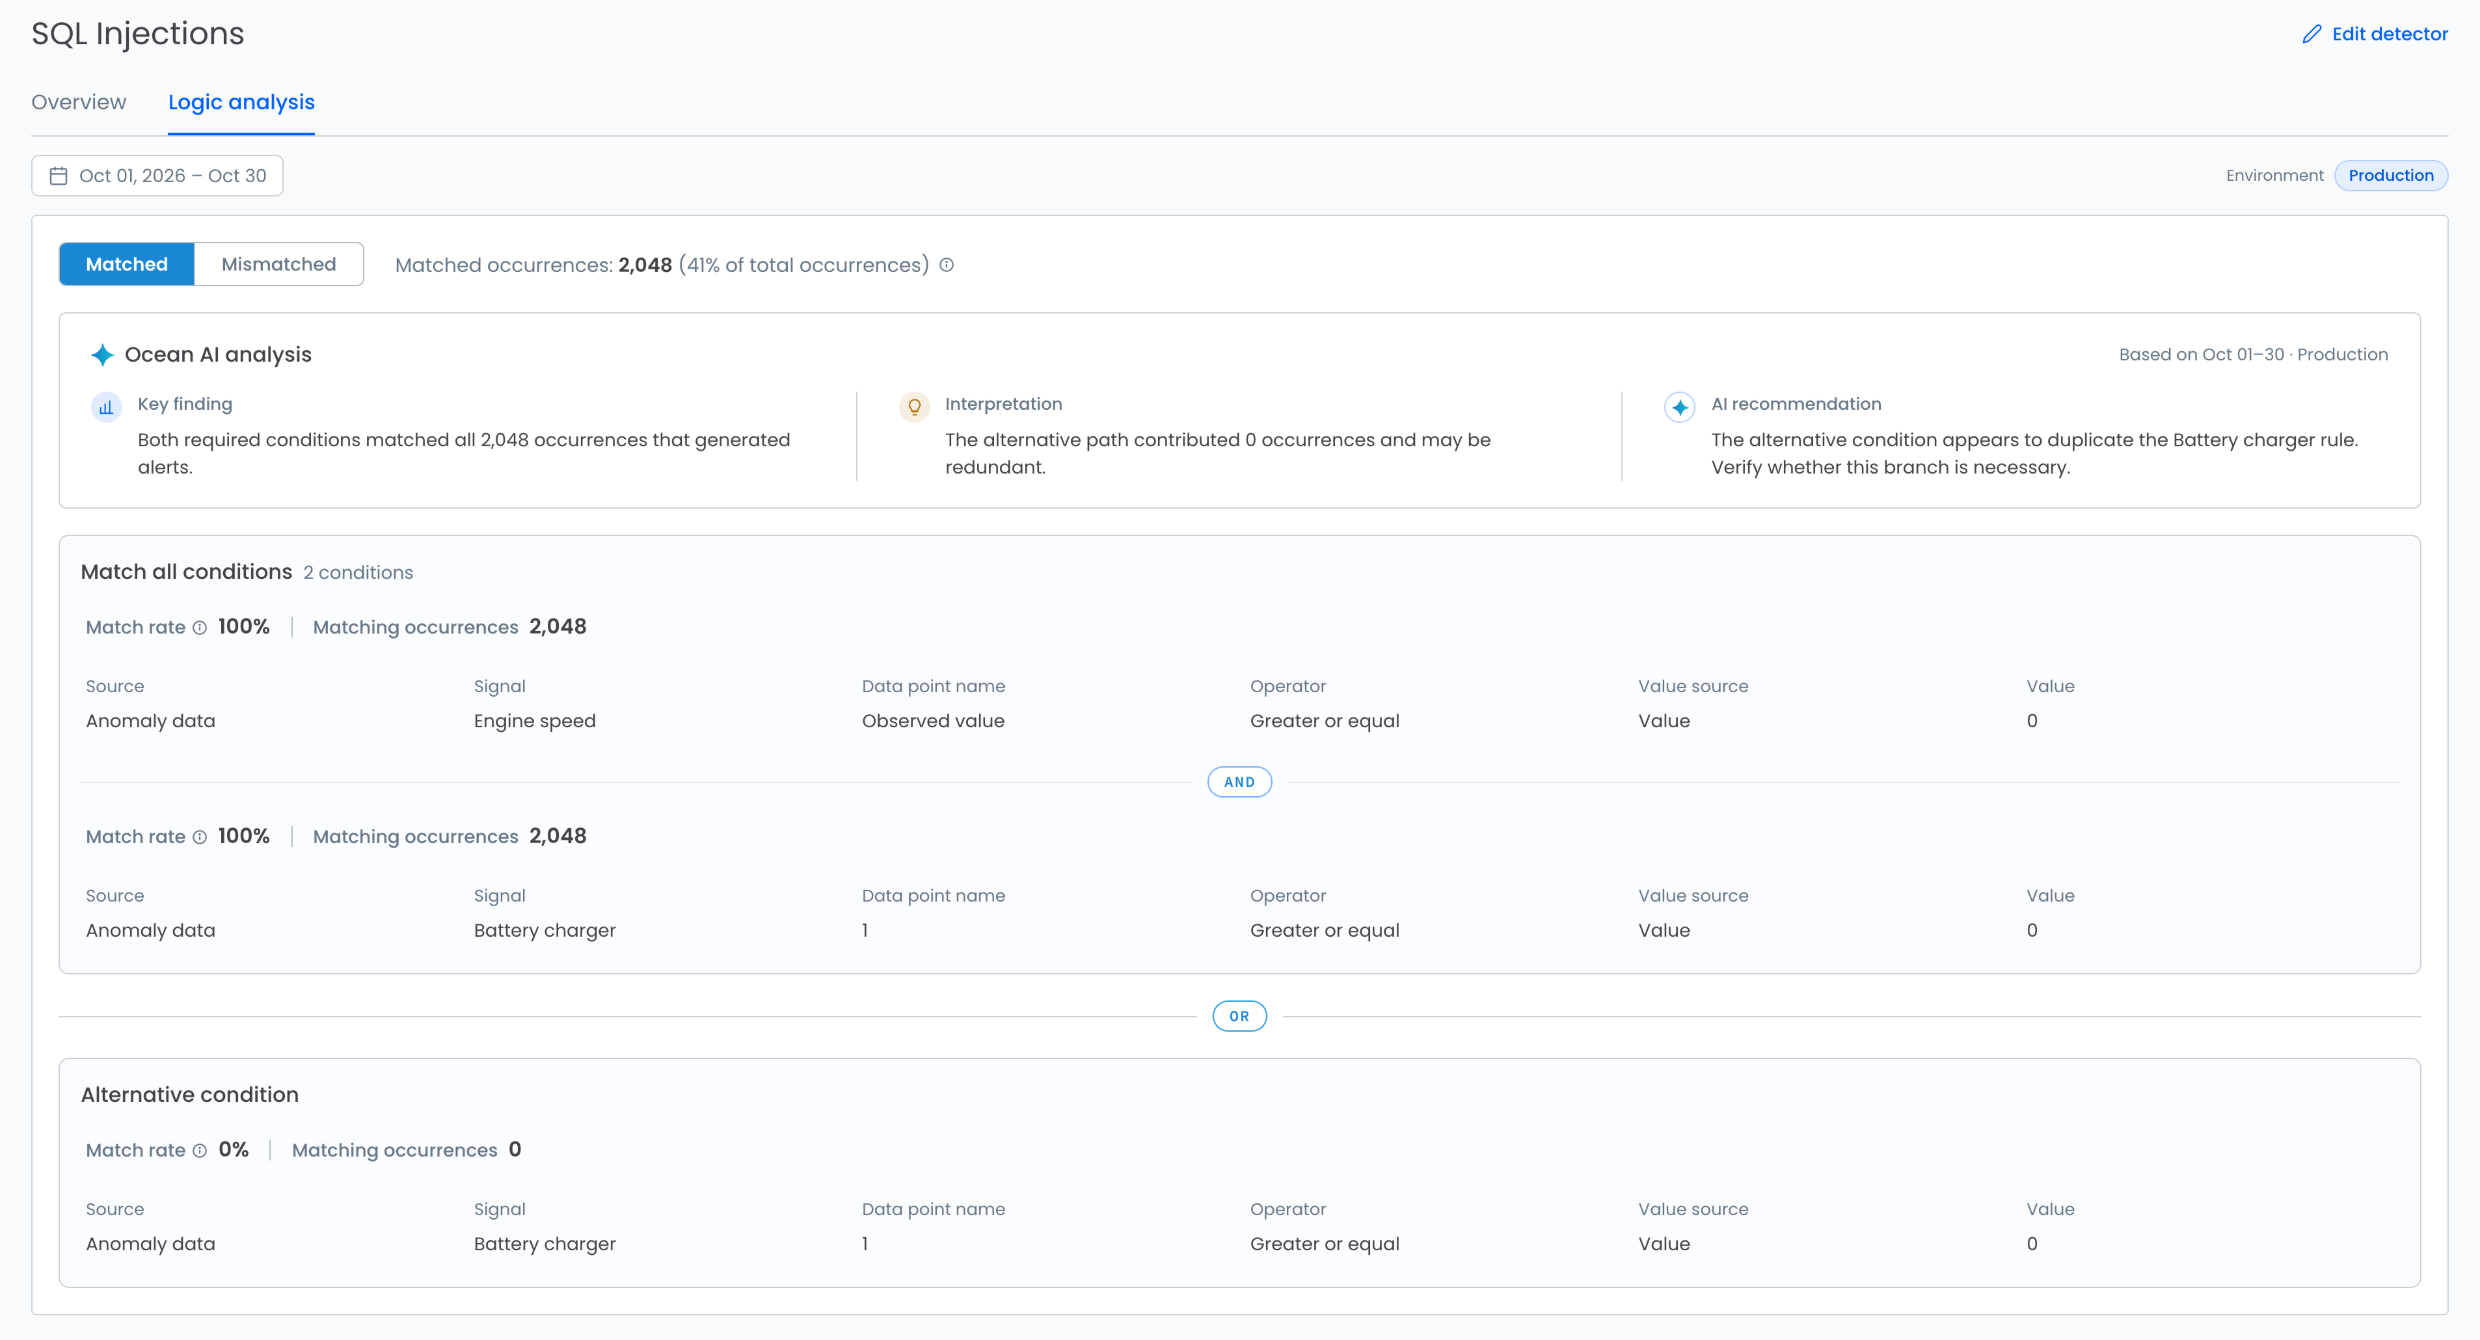
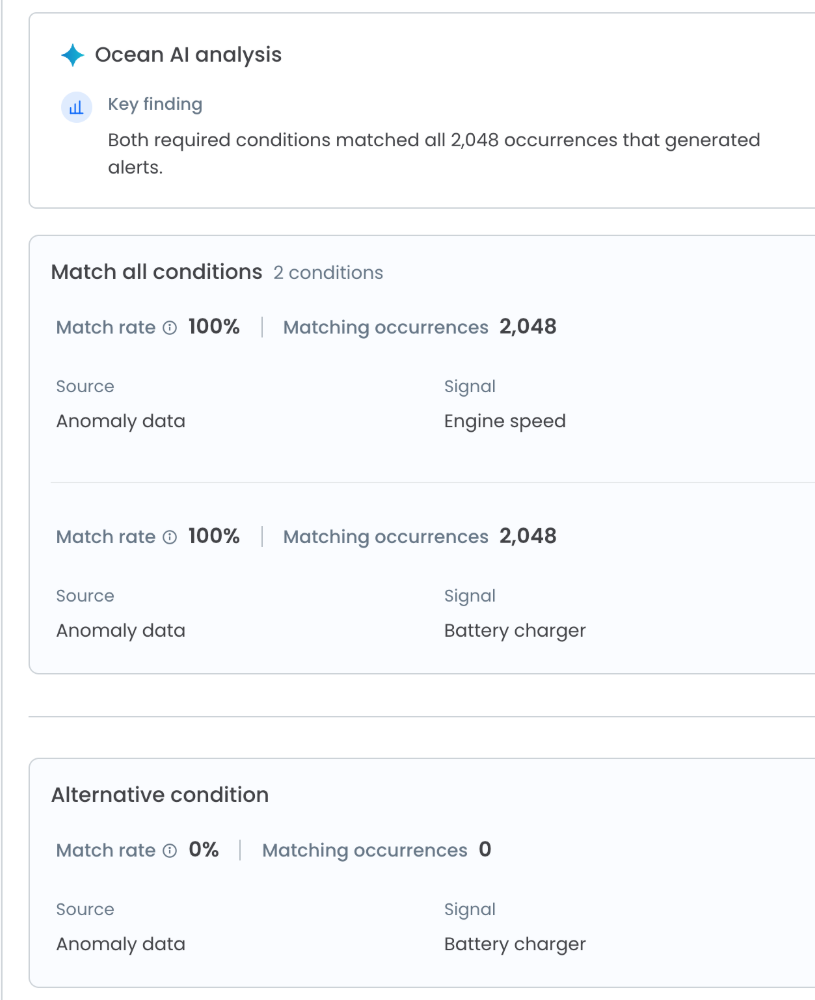
MATCHED

The Matched view shows which conditions contributed to alerts.

Both required conditions matched all 2,048 occurrences that generated alerts, while the alternative branch matched 0.

The AI analysis identifies the alternative path as potentially redundant and recommends reviewing whether it is necessary.

SQL Injections Logic analysis, Matched view: 2,048 matched occurrences (41% of total); Ocean AI analysis with key finding, interpretation and recommendation; both required conditions, Engine speed and Battery charger, at a 100% match rate with 2,048 matching occurrences; the alternative Battery charger condition at 0% Matched view, mobile crop: Ocean AI key finding that both required conditions matched all 2,048 occurrences; Engine speed and Battery charger at a 100% match rate; the alternative condition at 0%

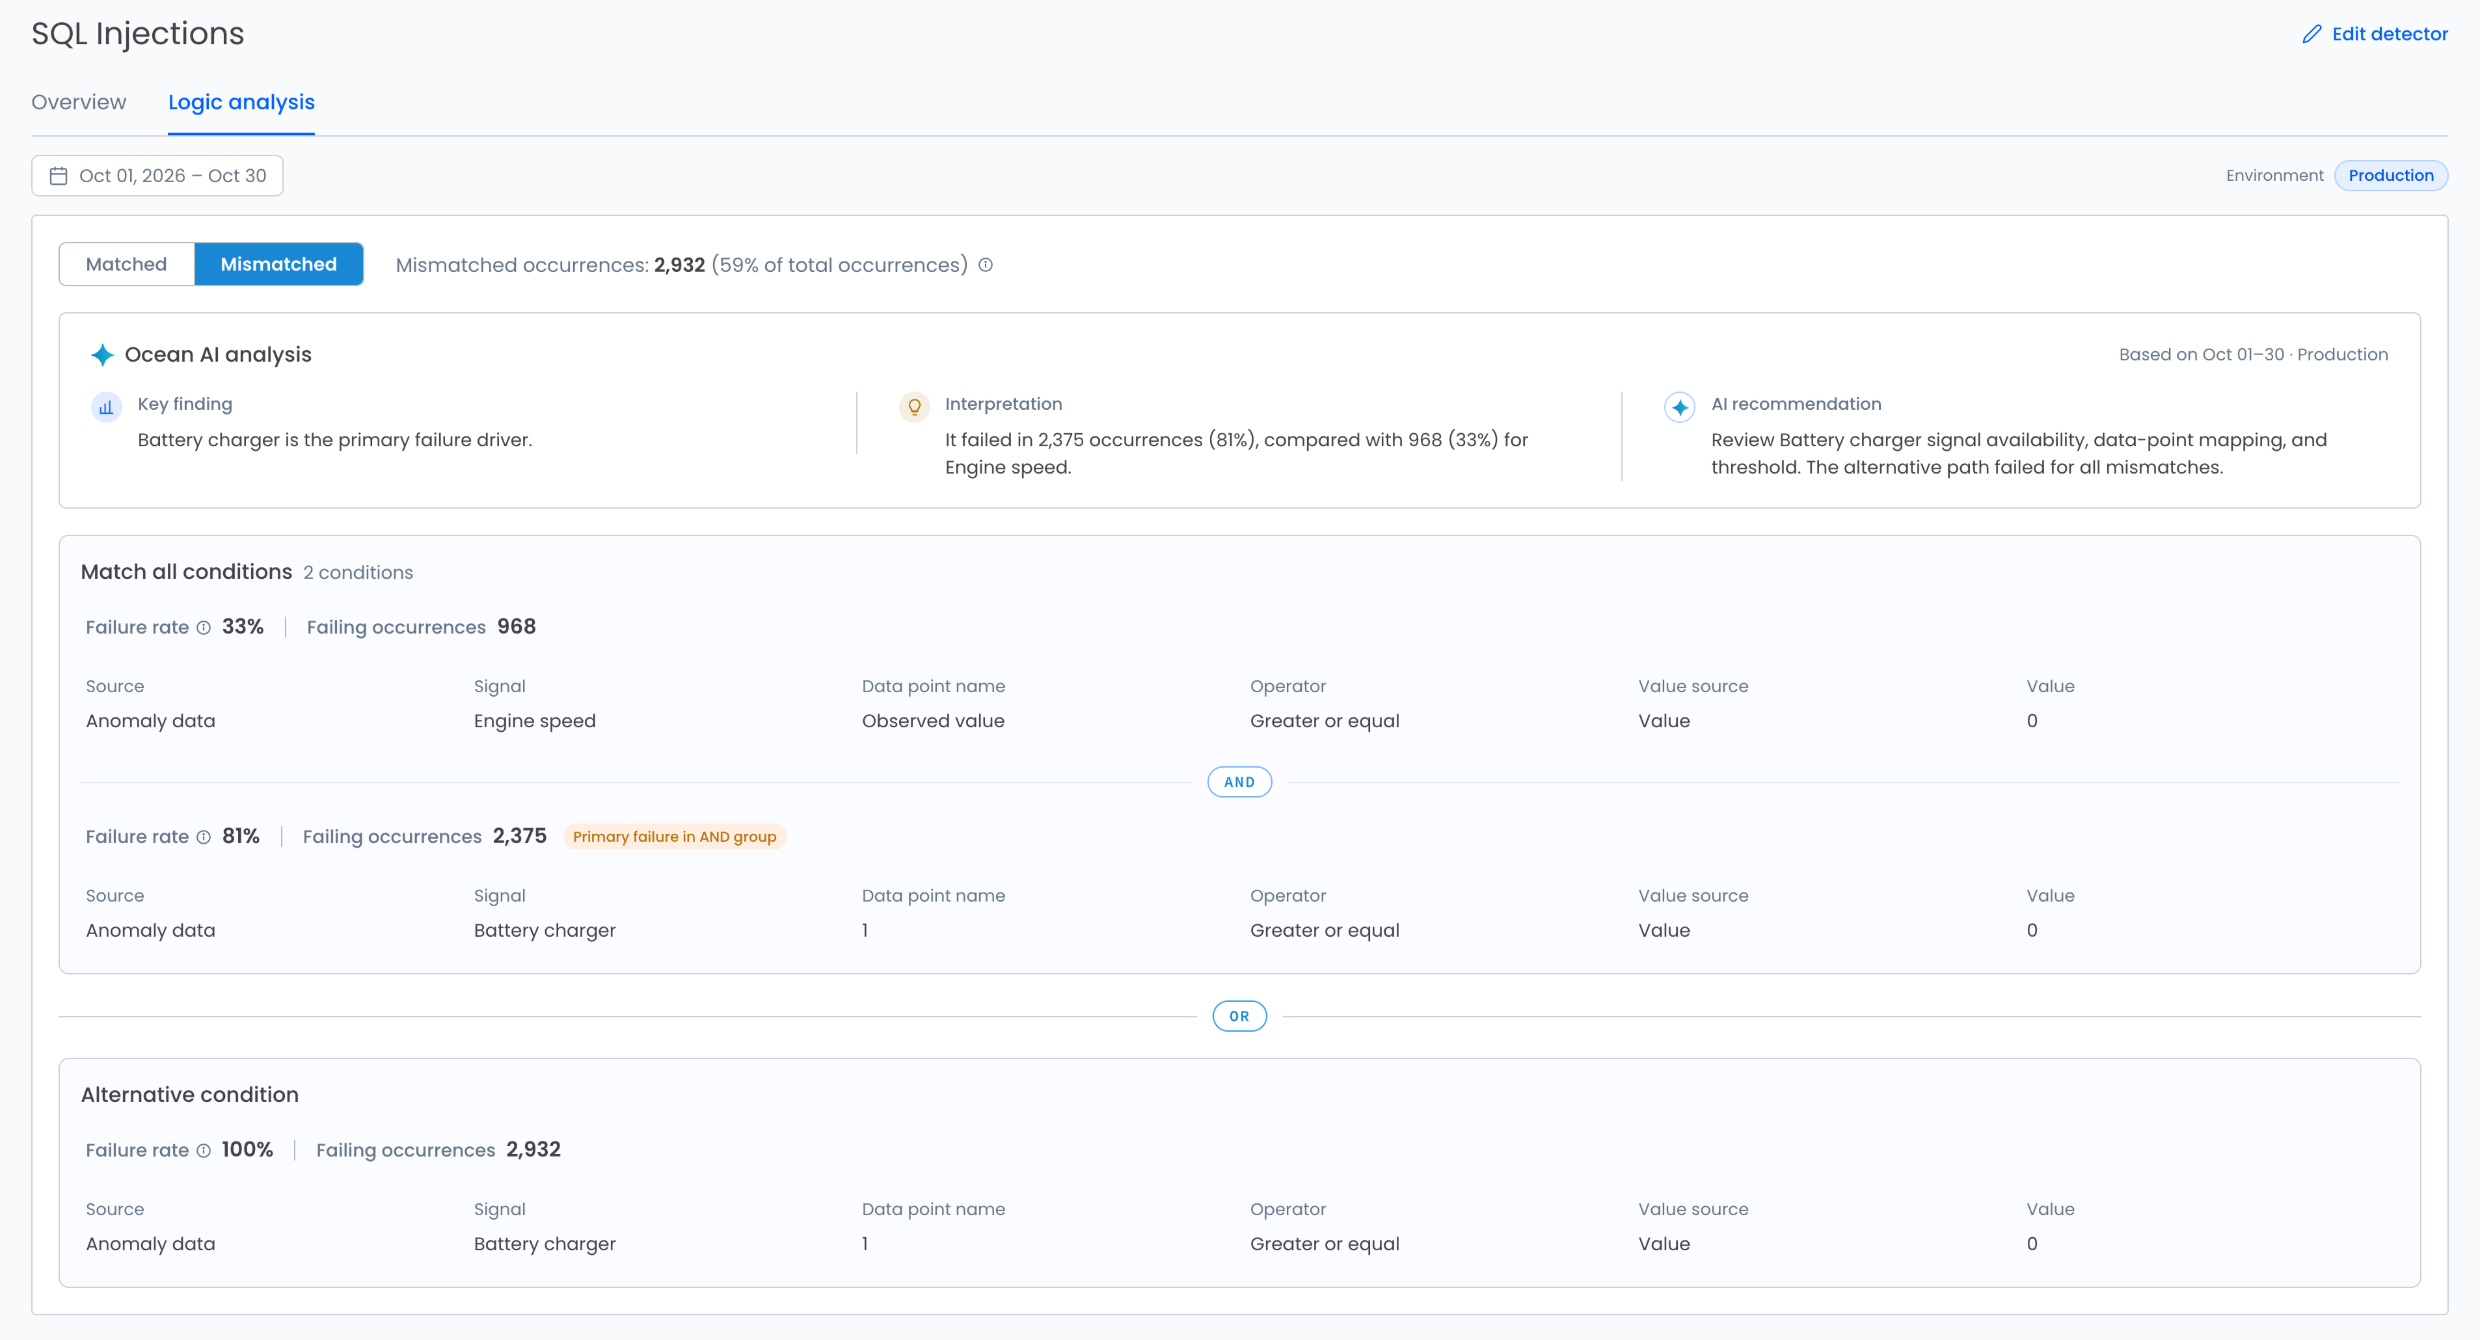
MISMATCHED

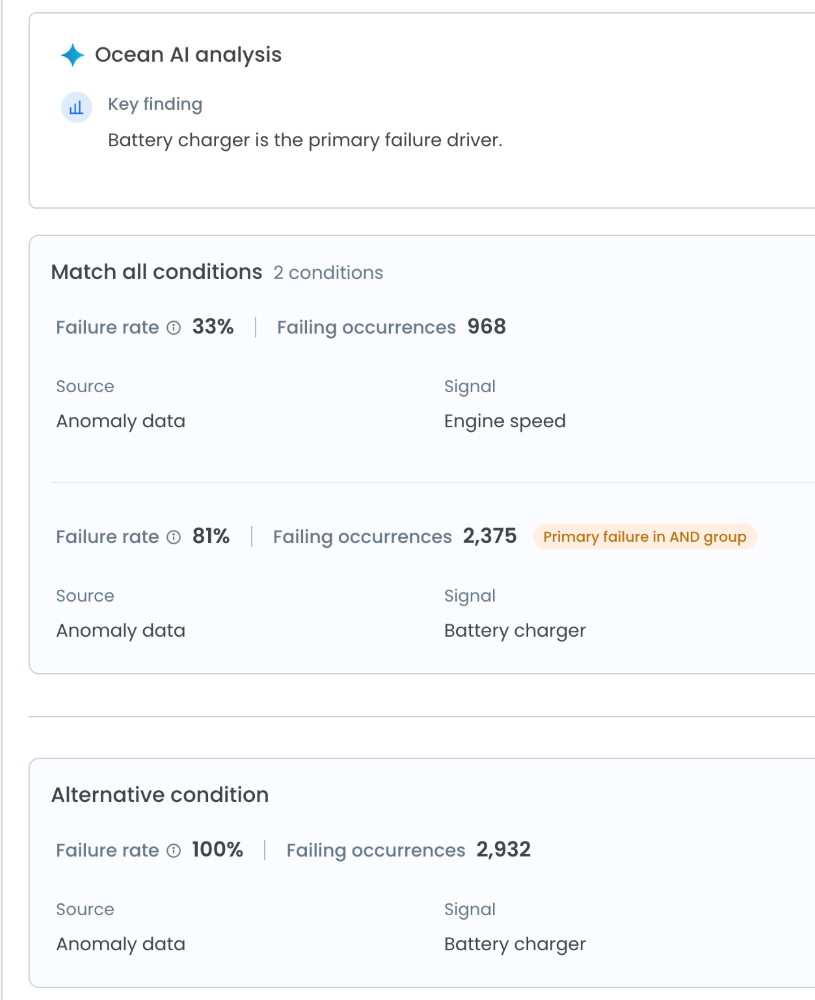
The Mismatched view shows which conditions prevented the remaining 2,932 occurrences from matching.

Engine speed
968 occurrences · 33%
Battery charger
2,375 occurrences · 81%

Battery charger is identified as the primary failure driver, directing the analyst toward signal availability, data-point mapping, and threshold configuration.

SQL Injections Logic analysis, Mismatched view: 2,932 mismatched occurrences (59% of total); Ocean AI analysis identifying Battery charger as the primary failure driver and recommending a review of signal availability, data-point mapping and threshold; Engine speed failing in 968 occurrences (33%), Battery charger in 2,375 (81%, primary failure in the AND group), and the alternative condition failing in all 2,932 Mismatched view, mobile crop: Ocean AI key finding that Battery charger is the primary failure driver; Engine speed failing at 33% (968), Battery charger at 81% (2,375, primary failure in the AND group); the alternative condition failing at 100% (2,932)

The result is not simply a visualization of detector logic. It explains how the logic behaves against real data.

05EVALUATE

Evaluate whether tuning actually improved the detector.

Understanding the problem is only part of the workflow.

Analysts also need to know whether previous changes improved detector quality.

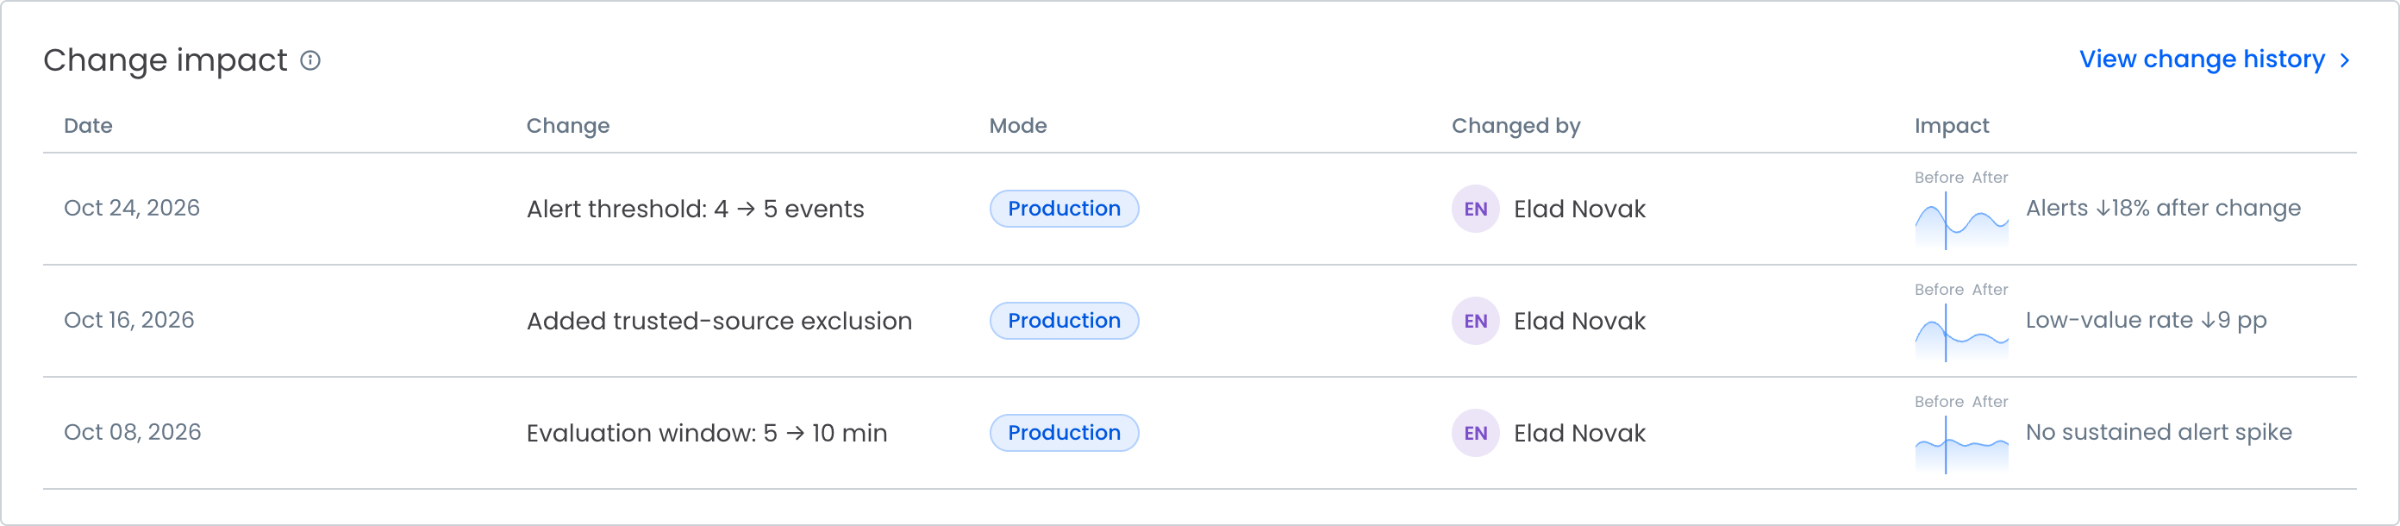
The Change Impact history connects configuration changes with the behavior observed afterwards.

  • Alert threshold: 4 → 5 eventsAlerts decreased 18% after the change
  • Added trusted-source exclusionLow-value rate decreased 9 percentage points
  • Evaluation window: 5 → 10 minNo sustained alert spike was observed
Change impact history for SQL Injections: Oct 24, 2026, alert threshold 4 to 5 events, alerts down 18% after the change; Oct 16, 2026, added trusted-source exclusion, low-value rate down 9 percentage points; Oct 08, 2026, evaluation window 5 to 10 minutes, no sustained alert spike; each with a before and after sparkline

This closes the feedback loop between investigation and tuning:

  1. Identify the problem
  2. Understand the cause
  3. Change the detector
  4. Evaluate the result

The redesign changes the Detectors experience from a page for managing individual detectors into a workflow for understanding and improving detection quality.

Find the noise.

Understand the detector.

Improve the signal.